Toyota 2011 Annual Report Download - page 96
Download and view the complete annual report
Please find page 96 of the 2011 Toyota annual report below. You can navigate through the pages in the report by either clicking on the pages listed below, or by using the keyword search tool below to find specific information within the annual report.-
 1
1 -
2
-
3
-
4
-
5
-
6
-
7
-
8
-
9
-
10
-
11
-
12
-
13
-
14
-
15
-
16
-
17
-
18
-
19
-
20
-
21
-
22
-
23
-
24
-
25
-
26
-
27
-
28
-
29
-
30
-
31
-
32
-
33
-
34
-
35
-
36
-
37
-
38
-
39
-
40
-
41
-
42
-
43
-
44
-
45
-
46
-
47
-
48
-
49
-
50
-
51
-
52
-
53
-
54
-
55
-
56
-
57
-
58
-
59
-
60
-
61
-
62
-
63
-
64
-
65
-
66
-
67
-
68
-
69
-
70
-
71
-
72
-
73
-
74
-
75
-
76
-
77
-
78
-
79
-
80
-
81
-
82
-
83
-
84
-
85
-
 86
86 -
 87
87 -
 88
88 -
 89
89 -
 90
90 -
 91
91 -
 92
92 -
 93
93 -
 94
94 -
 95
95 -
 96
96 -
 97
97 -
 98
98 -
 99
99 -
 100
100 -
 101
101 -
 102
102 -
 103
103 -
 104
104 -
 105
105 -
 106
106 -
107
-
108
-
109
-
110
-
111
-
112
-
113
 |
 |

0822
Financial Section and
Investor Information
Business and
Performance Review
Special FeatureMessage/Vision
Management and
Corporate Information
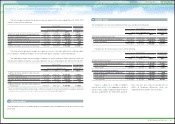
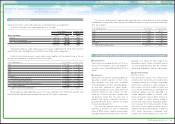
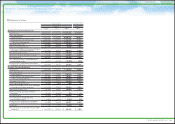
Notes to Consolidated Financial Statements
Fair value and gains or losses on derivative financial instruments
Yen in millions
U.S. dollars in millions
March 31, March 31,
2010 2011 2011
Derivative financial instruments designated as hedging instruments
Interest rate and currency swap agreements
Prepaid expenses and other current assets ¥ 45,567 ¥ 55,794 $ 671
Investments and other assets - Other 94,430 74,528 896
Total ¥ 139,997 ¥ 130,322 $ 1,567
Other current liabilities ¥ (21,786) ¥ (7,410) $ (89)
Other long-term liabilities (12,045) (1,188) (14)
Total ¥ (33,831) ¥ (8,598) $ (103)
Undesignated derivative financial instruments
Interest rate and currency swap agreements
Prepaid expenses and other current assets ¥ 54,474 ¥ 99,093 $ 1,192
Investments and other assets - Other 168,349 185,272 2,228
Total ¥ 222,823 ¥ 284,365 $ 3,420
Other current liabilities ¥ (38,152) ¥ (64,611) $ (777)
Other long-term liabilities (179,765) (132,785) (1,597)
Total ¥(217,917) ¥(197,396) $(2,374)
Foreign exchange forward and option contracts
Prepaid expenses and other current assets ¥ 6,135 ¥ 2,619 $ 32
Investments and other assets - Other 38 — —
Total ¥ 6,173 ¥ 2,619 $ 32
Other current liabilities ¥ (20,843) ¥ (14,202) $ (171)
Other long-term liabilities (138) (75) (1)
Total ¥ (20,981) ¥ (14,277) $ (172)
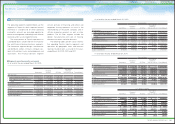
The following table summarizes the fair values of derivative financial instruments as of March 31, 2010
and 2011:
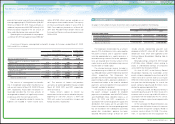
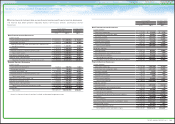
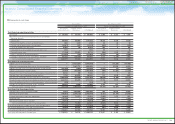
The following table summarizes the gains and losses on derivative financial instruments and hedged
items reported in the consolidated statement of income for the years ended March 31, 2009, 2010 and 2011:
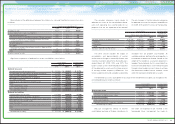
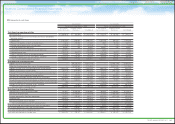
The following table summarizes the notional amounts of derivative financial instruments as of March
31, 2010 and 2011:
Yen in millions U.S. dollars in millions
March 31, March 31,
2010 2011 2011
Designated
derivative
financial
instruments
Undesignated
derivative
financial
instruments
Designated
derivative
financial
instruments
Undesignated
derivative
financial
instruments
Designated
derivative
financial
instruments
Undesignated
derivative
financial
instruments
Interest rate and currency
swap agreements ¥1,168,882 ¥11,868,039 ¥617,472 ¥11,460,275 $7,426 $137,826
Foreign exchange forward and
option contracts — 1,487,175 — 1,176,955 — 14,155
Total ¥1,168,882 ¥13,355,214 ¥617,472 ¥12,637,230 $7,426 $151,981
Yen in millions
For the years ended March 31,
2009 2010
Gains or
(losses) on
derivative
financial
instruments
Gains or
(losses) on
hedged items
Gains or
(losses) on
derivative
financial
instruments
Gains or
(losses) on
hedged items
Derivative financial instruments designated as
hedging instruments – Fair value hedge
Interest rate and currency swap agreements
Cost of financing operations ¥(288,553) ¥293,637 ¥138,677 ¥(135,163)
Interest expense (439) 439 (265) 265
Undesignated derivative financial instruments
Interest rate and currency swap agreements
Cost of financing operations ¥ (72,696) ¥ — ¥ 77,939 ¥ —
Foreign exchange gain (loss), net (3,016) — (2,819) —
Foreign exchange forward and option contracts
Cost of financing operations 24,183 — (21,841) —
Foreign exchange gain (loss), net 174,158 — 60,599 —
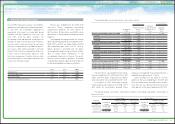
Yen in millions U.S. dollars in millions
For the year ended March 31, For the year ended March 31,
2011 2011
Gains or
(losses) on
derivative
financial
instruments
Gains or
(losses) on
hedged items
Gains or
(losses) on
derivative
financial
instruments
Gains or
(losses) on
hedged items
Derivative financial instruments designated as
hedging instruments – Fair value hedge
Interest rate and currency swap agreements
Cost of financing operations ¥ 71,491 ¥ (68,741) $ 860 $(827)
Interest expense (166) 166 (2) 2
Undesignated derivative financial instruments
Interest rate and currency swap agreements
Cost of financing operations ¥ 72,082 ¥ — $ 867 $ —
Foreign exchange gain (loss), net (1,393) — (17) —
Foreign exchange forward and option contracts
Cost of financing operations (2,693) — (32) —
Foreign exchange gain (loss), net 110,211 — 1,325 —
96
TOYOTA ANNUAL REPORT 2011