Toyota 2011 Annual Report Download - page 61
Download and view the complete annual report
Please find page 61 of the 2011 Toyota annual report below. You can navigate through the pages in the report by either clicking on the pages listed below, or by using the keyword search tool below to find specific information within the annual report.-
 1
1 -
2
-
3
-
4
-
5
-
6
-
7
-
8
-
9
-
10
-
11
-
12
-
13
-
14
-
15
-
16
-
17
-
18
-
19
-
20
-
21
-
22
-
23
-
24
-
25
-
26
-
27
-
28
-
29
-
30
-
31
-
32
-
33
-
34
-
35
-
36
-
37
-
38
-
39
-
40
-
41
-
42
-
43
-
44
-
45
-
46
-
47
-
48
-
49
-
50
-
 51
51 -
 52
52 -
 53
53 -
 54
54 -
 55
55 -
 56
56 -
 57
57 -
 58
58 -
 59
59 -
 60
60 -
 61
61 -
 62
62 -
 63
63 -
 64
64 -
 65
65 -
 66
66 -
 67
67 -
 68
68 -
 69
69 -
 70
70 -
 71
71 -
72
-
73
-
74
-
75
-
76
-
77
-
78
-
79
-
80
-
81
-
82
-
83
-
84
-
85
-
86
-
87
-
88
-
89
-
90
-
91
-
92
-
93
-
94
-
95
-
96
-
97
-
98
-
99
-
100
-
101
-
102
-
103
-
104
-
105
-
106
-
107
-
108
-
109
-
110
-
111
-
112
-
113
 |
 |

0822
Financial Section and
Investor Information
Business and
Performance Review
Special FeatureMessage/Vision
Management and
Corporate Information
Management's Discussion and Analysis of Financial Condition and Results of Operations
The provision for income taxes increased by
¥149.1 billion to ¥92.6 billion during fiscal 2010
compared with the prior year primarily due to the
increase in income before income taxes. The
effective tax rate was 31.8%, which was lower
than the statutory tax rate in Japan. This was
primarily due to the ¥741.4 billion increase in
income before income taxes of overseas
subsidiaries whose statutory tax rates were lower
than the statutory tax rate in Japan.
Net income attributable to the noncontrolling
interest increased by ¥59.0 billion to ¥34.8 billion
during fiscal 2010 compared with the prior year.
This increase was mainly due to an increase in
net income attributable to the shareholders of
consolidated subsidiaries.
Equity in earnings of affiliated companies
during fiscal 2010 increased by ¥2.7 billion, or
6.3%, to ¥45.4 billion compared with the prior
fiscal year. This increase was due to an increase
in net income attributable to the shareholders of
affiliated companies.
Net income attributable to Toyota Motor
Corporation increased by ¥646.4 billion to ¥209.4
billion during fiscal 2010 compared with the prior
fiscal year.
Other comprehensive income increased by
¥1,127.4 billion to ¥260.9 billion for fiscal 2010
compared with the prior fiscal year. This increase
resulted primarily from unrealized holding gains
on securities in fiscal 2010 of ¥176.4 billion
compared with losses of ¥293.1 billion in the prior
fiscal year, and from favorable foreign currency
translation adjustments of ¥9.8 billion in fiscal
2010 compared with losses of ¥381.3 billion in the
prior fiscal year. The increase in unrealized
holding gains on securities was mainly due to the
recognition of ¥139.6 billion impairment losses on
certain available-for-sale securities in the prior
fiscal year.
Income Taxes
Other Comprehensive Income and Loss
Net Income and Loss attributable to the
Noncontrolling Interest and Equity in
Earnings of Affiliated Companies
Net Income and Loss attributable to Toyota
Motor Corporation
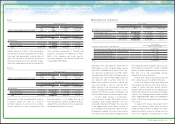
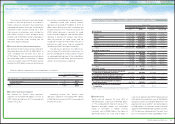
The following is a discussion of results of operations for each of Toyota’s operating segments. The
amounts presented are prior to intersegment elimination.
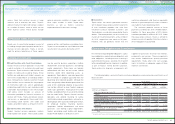
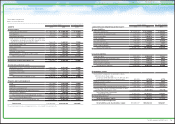
Segment Information
Yen in millions
Year ended March 31, 2010 vs. 2009 Change
2009 2010 Amount Percentage
Automotive Net revenues ¥18,564,723 ¥17,197,428 ¥(1,367,295) −7.4%
Operating income (loss) (394,876) (86,370) 308,506 —
Financial Services Net revenues ¥ 1,377,548 ¥ 1,245,407 ¥ (132,141) −9.6%
Operating income (loss) (71,947) 246,927 318,874 —
All Other Net revenues ¥ 1,184,947 ¥ 947,615 ¥ (237,332) −20.0%
Operating income (loss) 9,913 (8,860) (18,773) —
Intersegment elimination/
unallocated amount:
Net revenues ¥ (597,648) ¥ (439,477) ¥ 158,171 —
Operating income (loss) (4,101) (4,181) (80) —
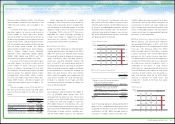
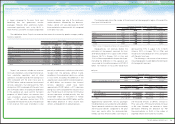
The increase in operating income in Asia was
mainly due to the ¥20.0 billion impact of increase
in production volume and vehicle unit sales and
the ¥10.0 billion impact of cost reduction efforts in
the automotive operations segment, and other
efforts, partially offset by the ¥16.2 billion impact
of fluctuations in foreign currency translation
rates. The increase in production volume and the
increase in vehicle unit sales by 74 thousand
vehicles in Asia compared to the prior fiscal year
were primarily attributable to the recovery of Asian
automotive markets, particularly in Thailand and
Indonesia, benefiting from the government
stimulus packages.
Interest and dividend income decreased by ¥60.2
billion, or 43.5%, to ¥78.2 billion during fiscal 2010
compared with the prior fiscal year mainly due to
the ¥45.2 billion decrease in interest income
reflecting decreases in market interest rates.
Interest expense decreased by ¥13.5 billion,
or 28.7%, to ¥33.4 billion during fiscal 2010
compared with the prior fiscal year.
Foreign exchange gains, net increased by
¥70.0 billion to ¥68.2 billion during fiscal 2010
compared with the prior fiscal year. Foreign
exchange gains and losses include the differences
between the value of foreign currency denominated
sales translated at prevailing exchange rates and
the value of the sales amounts settled during the
year, including those settled using forward foreign
currency exchange contracts. During fiscal 2010,
the currencies of various countries strengthened
against the U.S. dollar rapidly. In such a situation,
Toyota records foreign exchange transaction
gains from accounts payable and long term U.S.
dollar denominated debt of subsidiaries. A main
factor contributing to the significantly greater level
of impact of foreign exchange on fiscal 2010
results is that Toyota’s Canadian subsidiaries
recorded a ¥50.0 billion foreign exchange gain
from long term debt payables in U.S. dollar to
Toyota compared with the prior fiscal year, as the
Canadian dollar strengthened against the U.S.
dollar rapidly during fiscal 2010.
Other income, net increased by ¥220.0 billion
to ¥30.9 billion during fiscal 2010 compared with
the prior fiscal year. This increase was mainly due
to the recognition of ¥139.6 billion impairment
losses on certain available-for-sale securities in
the prior fiscal year.
Other Income and Expenses
Yen in millions
2010 vs. 2009
Change
Changes in operating income and loss:
Effect of increase in production
volume and vehicle unit sales and
other operational factors ¥ 20,000
Effect of fluctuation in foreign
currency translation rates (16,200)
Effect of cost reduction efforts,
decrease in fixed costs and
other efforts 23,667
Total ¥ 27,467
Asia
61TOYOTA ANNUAL REPORT 2011