Toyota 2011 Annual Report Download - page 48
Download and view the complete annual report
Please find page 48 of the 2011 Toyota annual report below. You can navigate through the pages in the report by either clicking on the pages listed below, or by using the keyword search tool below to find specific information within the annual report.-
 1
1 -
2
-
3
-
4
-
5
-
6
-
7
-
8
-
9
-
10
-
11
-
12
-
13
-
14
-
15
-
16
-
17
-
18
-
19
-
20
-
21
-
22
-
23
-
24
-
25
-
26
-
27
-
28
-
29
-
30
-
31
-
32
-
33
-
34
-
35
-
36
-
37
-
 38
38 -
 39
39 -
 40
40 -
 41
41 -
 42
42 -
 43
43 -
 44
44 -
 45
45 -
 46
46 -
 47
47 -
 48
48 -
 49
49 -
 50
50 -
 51
51 -
 52
52 -
 53
53 -
 54
54 -
 55
55 -
 56
56 -
 57
57 -
 58
58 -
59
-
60
-
61
-
62
-
63
-
64
-
65
-
66
-
67
-
68
-
69
-
70
-
71
-
72
-
73
-
74
-
75
-
76
-
77
-
78
-
79
-
80
-
81
-
82
-
83
-
84
-
85
-
86
-
87
-
88
-
89
-
90
-
91
-
92
-
93
-
94
-
95
-
96
-
97
-
98
-
99
-
100
-
101
-
102
-
103
-
104
-
105
-
106
-
107
-
108
-
109
-
110
-
111
-
112
-
113
 |
 |
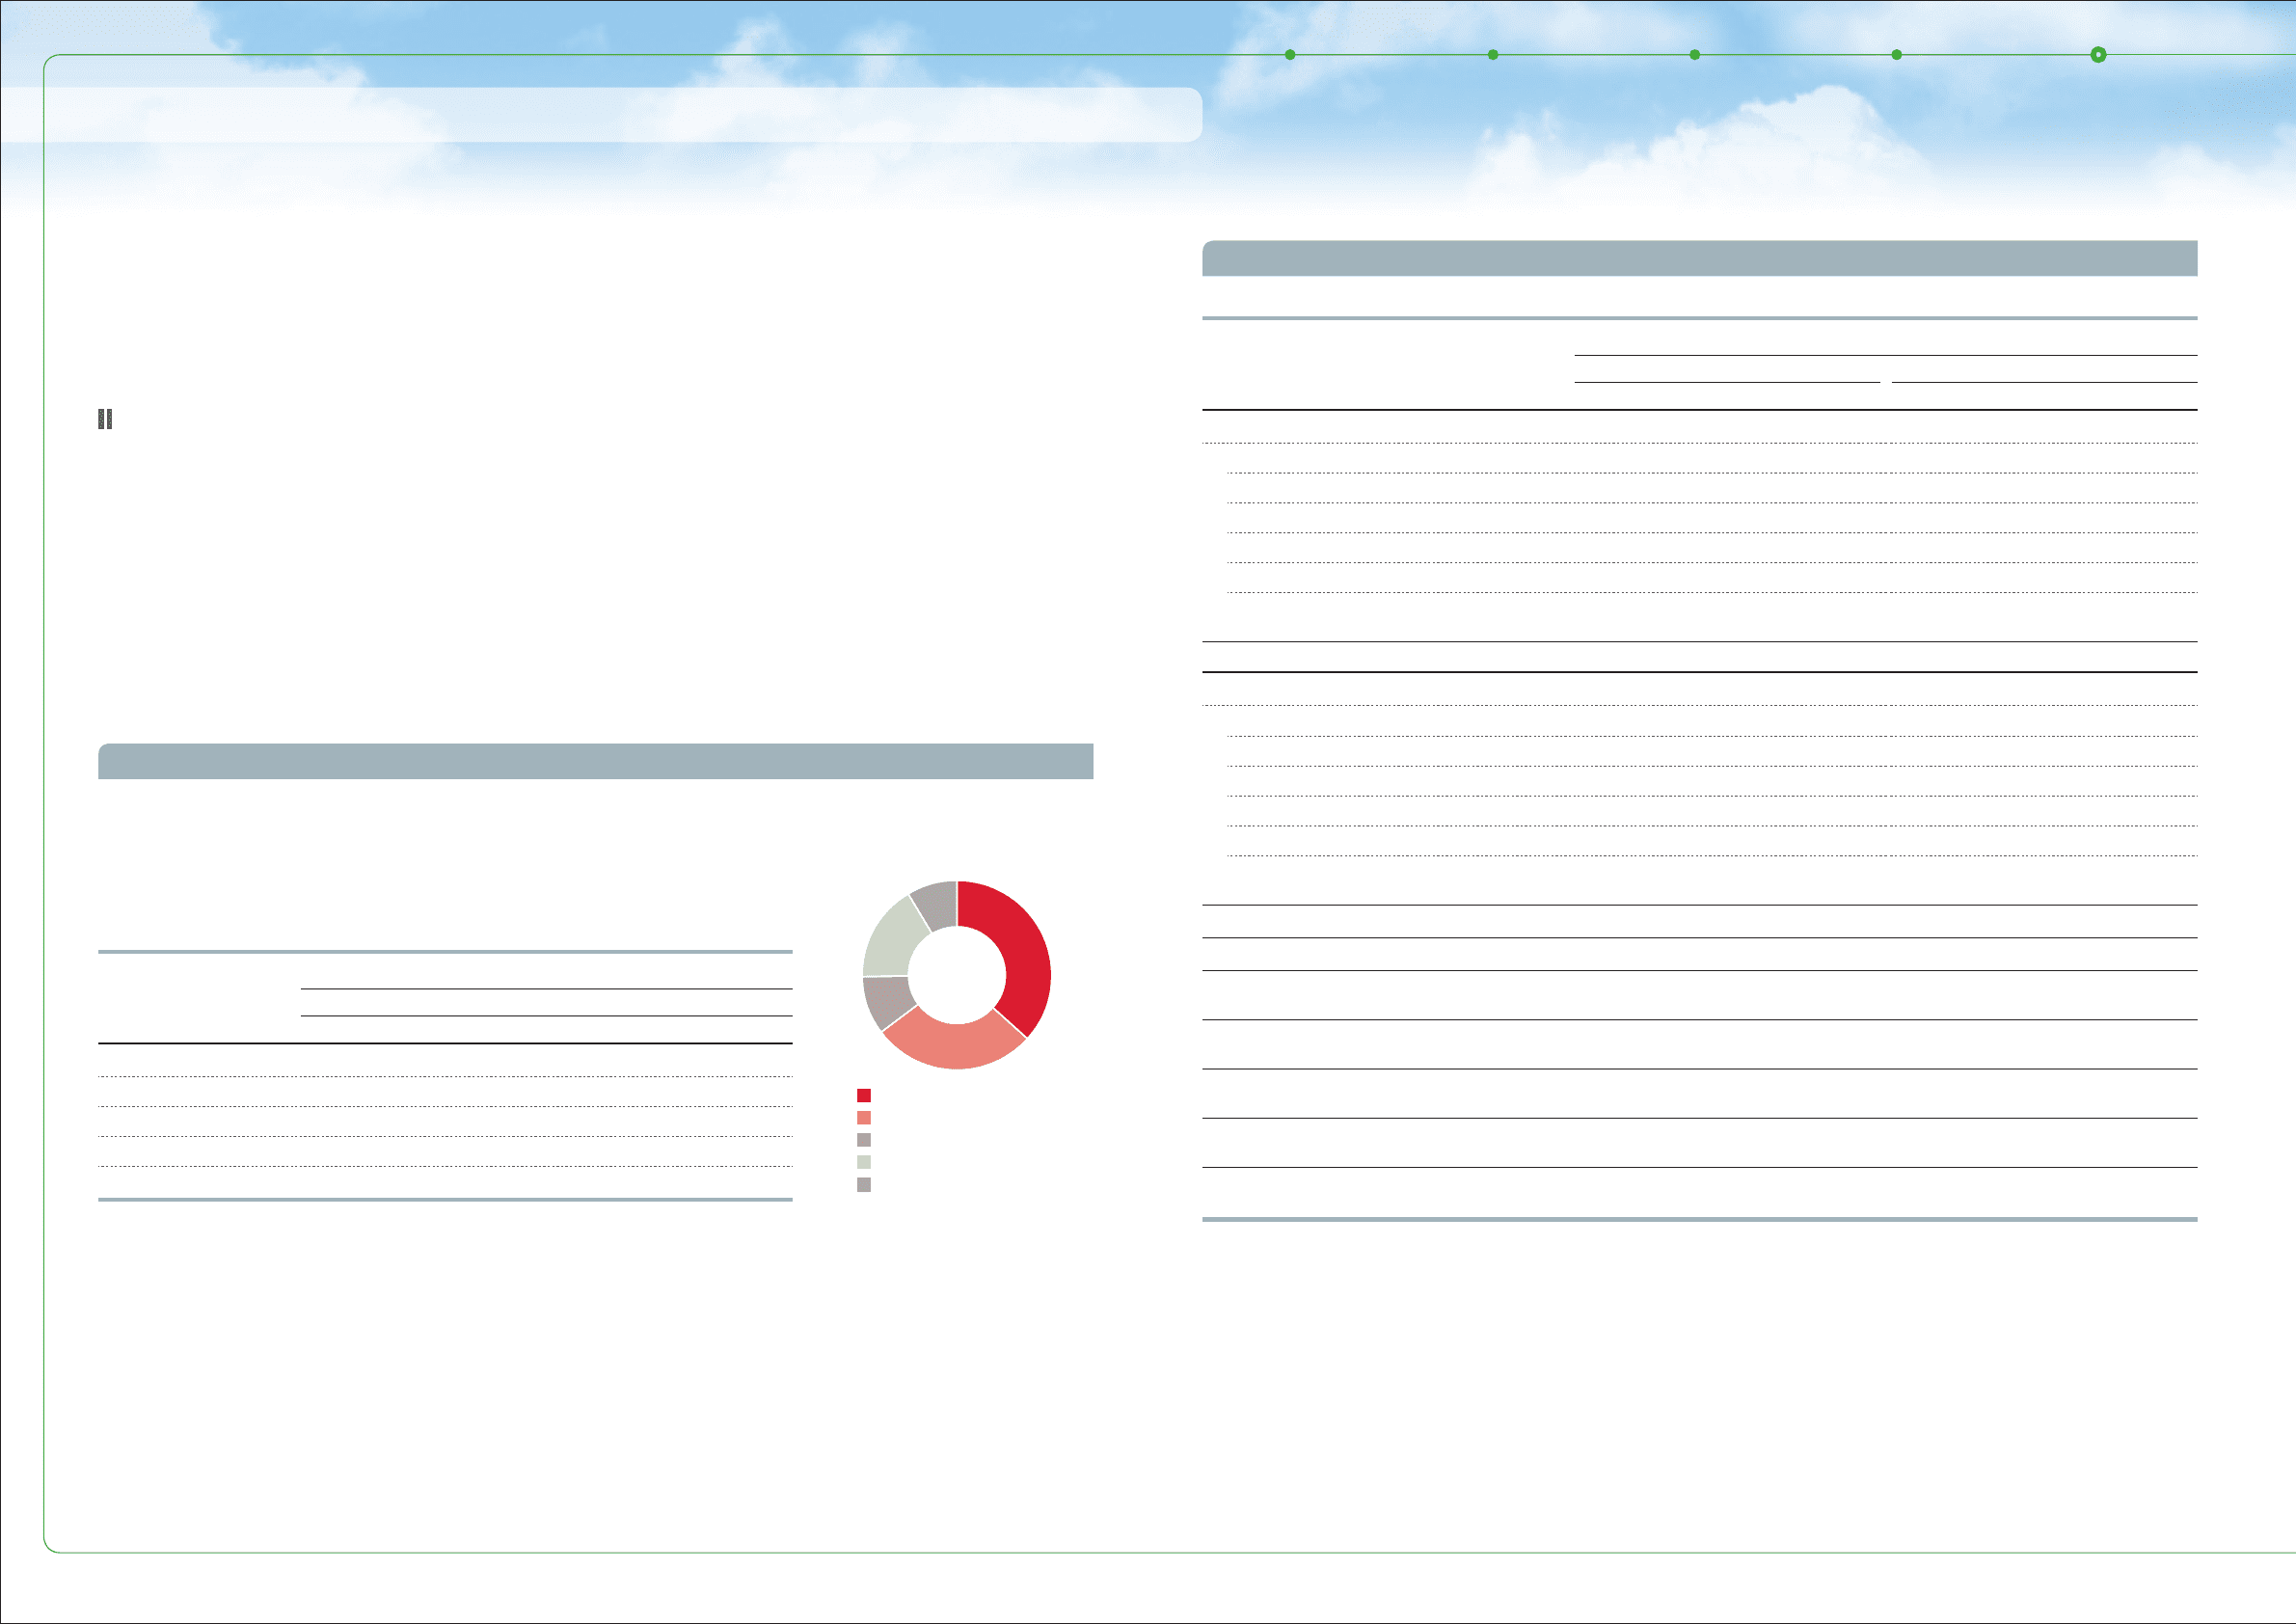
Geographic Breakdown
Results of Operations — Fiscal 2011 Compared with Fiscal 2010
0822
Financial Section and
Investor Information
Business and
Performance Review
Special FeatureMessage/Vision
Management and
Corporate Information
Management's Discussion and Analysis of Financial Condition and Results of Operations
results excluding the impact of currency
fluctuations year-on-year provide additional useful
information to investors regarding the operating
performance on a local currency basis.
Segmentation
Toyota’s most significant business segment is its
automotive operations. Toyota carries out its
automotive operations as a global competitor in
the worldwide automotive market. Management
allocates resources to, and assesses the
performance of, its automotive operations as a
single business segment on a worldwide basis.
Toyota does not manage any subset of its
automotive operations, such as domestic or
overseas operations or parts, as separate
management units.
The management of the automotive operations
is aligned on a functional basis with managers
having oversight responsibility for the major
operating functions within the segment.
Management assesses financial and non-financial
data such as vehicle unit sales, production
volume, market share information, vehicle model
plans and plant location costs to allocate
resources within the automotive operations.
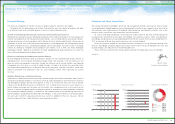
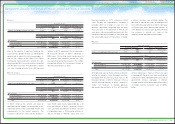
The following table sets forth Toyota’s net revenues in each geographic
market based on the country location of the parent company or the
subsidiaries that transacted the sale with the external customer for the
past three fiscal years.
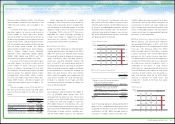
Japan 36.7 %
North America 28.1 %
Europe 10.1 %
Asia 16.5 %
All Other Markets 8.6 %
Yen in millions
Year ended March 31,
2009 2010 2011
Japan ¥7,471,916 ¥7,314,813 ¥6,966,929
North America 6,097,676 5,583,228 5,327,809
Europe 2,889,753 2,082,671 1,920,416
Asia 2,450,412 2,431,648 3,138,112
Other* 1,619,813 1,538,613 1,640,422
Revenues by Market
FY2011
* “Other” consists of Central and South America, Oceania and Africa.
* “Other” consists of Central and South America, Oceania and Africa.
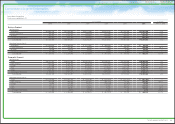
Yen in millions
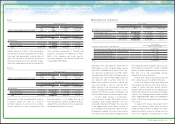
Year ended March 31, 2011 vs. 2010 Change
2010 2011 Amount Percentage
Net revenues:
Japan ¥11,220,303 ¥10,986,246 ¥ (234,057) −2.1%
North America 5,670,526 5,429,136 (241,390) −4.3%
Europe 2,147,049 1,981,497 (165,552) −7.7%
Asia 2,655,327 3,374,534 719,207 +27.1%
Other* 1,673,861 1,809,116 135,255 +8.1%
Intersegment elimination/
unallocated amount (4,416,093) (4,586,841) (170,748) —
Total ¥18,950,973 ¥18,993,688 ¥ 42,715 +0.2%
Operating income (loss):
Japan ¥ (225,242) ¥ (362,396) ¥ (137,154) —
North America 85,490 339,503 254,013 +297.1%
Europe (32,955) 13,148 46,103 —
Asia 203,527 312,977 109,450 +53.8%
Other* 115,574 160,129 44,555 +38.6%
Intersegment elimination/
unallocated amount 1,122 4,918 3,796 +338.3%
Total ¥ 147,516 ¥ 468,279 ¥ 320,763 +217.4%
Operating margin 0.8% 2.5% 1.7%
Income before income taxes and equity
in earnings of affiliated companies
291,468 563,290 271,822 +93.3%
Net margin from income before income taxes
and equity in earnings of affiliated companies
1.5% 3.0% 1.5%
Equity in earnings of affiliated
companies 45,408 215,016 169,608 +373.5%
Net income attributable to Toyota
Motor Corporation 209,456 408,183 198,727 +94.9%
Net margin attributable to Toyota
Motor Corporation 1.1% 2.1% 1.0%
48
TOYOTA ANNUAL REPORT 2011