Toyota 2011 Annual Report Download - page 70
Download and view the complete annual report
Please find page 70 of the 2011 Toyota annual report below. You can navigate through the pages in the report by either clicking on the pages listed below, or by using the keyword search tool below to find specific information within the annual report.-
 1
1 -
2
-
3
-
4
-
5
-
6
-
7
-
8
-
9
-
10
-
11
-
12
-
13
-
14
-
15
-
16
-
17
-
18
-
19
-
20
-
21
-
22
-
23
-
24
-
25
-
26
-
27
-
28
-
29
-
30
-
31
-
32
-
33
-
34
-
35
-
36
-
37
-
38
-
39
-
40
-
41
-
42
-
43
-
44
-
45
-
46
-
47
-
48
-
49
-
50
-
51
-
52
-
53
-
54
-
55
-
56
-
57
-
58
-
59
-
 60
60 -
 61
61 -
 62
62 -
 63
63 -
 64
64 -
 65
65 -
 66
66 -
 67
67 -
 68
68 -
 69
69 -
 70
70 -
 71
71 -
 72
72 -
 73
73 -
 74
74 -
 75
75 -
 76
76 -
 77
77 -
 78
78 -
 79
79 -
 80
80 -
81
-
82
-
83
-
84
-
85
-
86
-
87
-
88
-
89
-
90
-
91
-
92
-
93
-
94
-
95
-
96
-
97
-
98
-
99
-
100
-
101
-
102
-
103
-
104
-
105
-
106
-
107
-
108
-
109
-
110
-
111
-
112
-
113
 |
 |

0822
Financial Section and
Investor Information
Business and
Performance Review
Special FeatureMessage/Vision
Management and
Corporate Information
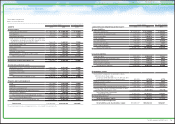
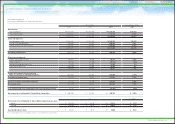
Consolidated Balance Sheets
Yen in millions
U.S. dollars in millions
ASSETS 2010 2011 2011
Current assets
Cash and cash equivalents ¥ 1,865,746 ¥ 2,080,709 $ 25,024
Time deposits 392,724 203,874 2,452
Marketable securities 1,793,165 1,225,435 14,738
Trade accounts and notes receivable, less allowance
for doubtful accounts of ¥13,735 million in 2010
and ¥11,856 million ($143 million) in 2011 1,886,273 1,449,151 17,428
Finance receivables, net 4,209,496 4,136,805 49,751
Other receivables 360,379 306,201 3,682
Inventories 1,422,373 1,304,242 15,685
Deferred income taxes 632,164 605,884 7,287
Prepaid expenses and other current assets 511,284 517,454 6,223
Total current assets 13,073,604 11,829,755 142,270
Noncurrent finance receivables, net 5,630,680 5,556,746 66,828
Investments and other assets
Marketable securities and other securities investments
2,256,279 3,571,187 42,949
Affiliated companies 1,879,320 1,827,331 21,976
Employees receivables 67,506 62,158 748
Other 730,997 661,829 7,959
Total investments and other assets 4,934,102 6,122,505 73,632
Property, plant and equipment
Land 1,261,349 1,237,620 14,884
Buildings 3,693,972 3,635,605 43,724
Machinery and equipment 9,298,967 8,947,350 107,605
Vehicles and equipment on operating leases 2,613,248 2,491,946 29,969
Construction in progress 226,212 298,828 3,594
Total property, plant and equipment, at cost 17,093,748 16,611,349 199,776
Less – Accumulated depreciation (10,382,847) (10,302,189) (123,899)
Total property, plant and equipment, net 6,710,901 6,309,160 75,877
Total assets ¥ 30,349,287 ¥ 29,818,166 $ 358,607
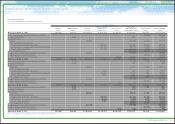
Yen in millions
U.S. dollars in millions
LIABILITIES AND SHAREHOLDERS’ EQUITY 2010 2011 2011
Current liabilities
Short-term borrowings ¥ 3,279,673 ¥ 3,179,009 $ 38,232
Current portion of long-term debt 2,218,324 2,772,827 33,347
Accounts payable 1,956,505 1,503,072 18,077
Other payables 572,450 579,326 6,967
Accrued expenses 1,735,930 1,773,233 21,326
Income taxes payable 153,387 112,801 1,357
Other current liabilities 769,945 870,722 10,472
Total current liabilities 10,686,214 10,790,990 129,778
Long-term liabilities
Long-term debt 7,015,409 6,449,220 77,561
Accrued pension and severance costs 678,677 668,022 8,034
Deferred income taxes 813,221 810,127 9,743
Other long-term liabilities 225,323 179,783 2,162
Total long-term liabilities 8,732,630 8,107,152 97,500
Shareholders’ equity
Toyota Motor Corporation shareholders' equity
Common stock, no par value,
authorized: 10,000,000,000 shares in 2010 and 2011;
issued: 3,447,997,492 shares in 2010 and 2011
397,050 397,050 4,775
Additional paid-in capital 501,331 505,760 6,083
Retained earnings 11,568,602 11,835,665 142,341
Accumulated other comprehensive income (loss) (846,835) (1,144,721) (13,767)
Treasury stock, at cost, 312,002,149 shares in 2010
and 312,298,805 shares in 2011 (1,260,425) (1,261,383) (15,170)
Total Toyota Motor Corporation
shareholders’ equity 10,359,723 10,332,371 124,262
Noncontrolling interest 570,720 587,653 7,067
Total shareholders’ equity 10,930,443 10,920,024 131,329
Commitments and contingencies
Total liabilities and shareholders’ equity ¥30,349,287 ¥29,818,166 $358,607
The accompanying notes are an integral part of these consolidated financial statements.
Toyota Motor Corporation
March 31, 2010 and 2011
70
TOYOTA ANNUAL REPORT 2011