Toyota 2011 Annual Report Download - page 72
Download and view the complete annual report
Please find page 72 of the 2011 Toyota annual report below. You can navigate through the pages in the report by either clicking on the pages listed below, or by using the keyword search tool below to find specific information within the annual report.-
 1
1 -
2
-
3
-
4
-
5
-
6
-
7
-
8
-
9
-
10
-
11
-
12
-
13
-
14
-
15
-
16
-
17
-
18
-
19
-
20
-
21
-
22
-
23
-
24
-
25
-
26
-
27
-
28
-
29
-
30
-
31
-
32
-
33
-
34
-
35
-
36
-
37
-
38
-
39
-
40
-
41
-
42
-
43
-
44
-
45
-
46
-
47
-
48
-
49
-
50
-
51
-
52
-
53
-
54
-
55
-
56
-
57
-
58
-
59
-
60
-
61
-
 62
62 -
 63
63 -
 64
64 -
 65
65 -
 66
66 -
 67
67 -
 68
68 -
 69
69 -
 70
70 -
 71
71 -
 72
72 -
 73
73 -
 74
74 -
 75
75 -
 76
76 -
 77
77 -
 78
78 -
 79
79 -
 80
80 -
 81
81 -
 82
82 -
83
-
84
-
85
-
86
-
87
-
88
-
89
-
90
-
91
-
92
-
93
-
94
-
95
-
96
-
97
-
98
-
99
-
100
-
101
-
102
-
103
-
104
-
105
-
106
-
107
-
108
-
109
-
110
-
111
-
112
-
113
 |
 |

0822
Financial Section and
Investor Information
Business and
Performance Review
Special FeatureMessage/Vision
Management and
Corporate Information
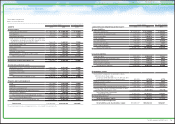
Consolidated Statements of Shareholders’ Equity
Yen in millions
Common
stock
Additional paid-in
capital
Retained
earnings
Accumulated other
comprehensive
income (loss)
Treasury stock,
at cost
Total Toyota
Motor Corporation
shareholders’ equity
Noncontrolling
interest
Total shareholders’
equity
Balances at March 31, 2008 ¥397,050 ¥497,569 ¥12,408,550 ¥ (241,205) ¥(1,192,437) ¥11,869,527 ¥656,667 ¥12,526,194
Equity transaction with noncontrolling interests and other (30,645) (30,645)
Issuance during the year 3,642 3,642 3,642
Comprehensive loss
Net loss (436,937) (436,937) (24,278) (461,215)
Other comprehensive income (loss)
Foreign currency translation adjustments (381,303) (381,303) (18,865) (400,168)
Unrealized losses on securities, net of reclassification adjustments
(293,101) (293,101) (13,590) (306,691)
Pension liability adjustments (192,172) (192,172) (8,874) (201,046)
Total comprehensive loss (1,303,513) (65,607) (1,369,120)
Dividends paid to Toyota Motor Corporation shareholders (439,991) (439,991) (439,991)
Dividends paid to noncontrolling interests (20,885) (20,885)
Purchase and reissuance of common stock (68,458) (68,458) (68,458)
Balances at March 31, 2009 397,050 501,211 11,531,622 (1,107,781) (1,260,895) 10,061,207 539,530 10,600,737
Equity transaction with noncontrolling interests and other (2,116) (2,116) (2,748) (4,864)
Issuance during the year 2,236 2,236 2,236
Comprehensive income
Net income 209,456 209,456 34,756 244,212
Other comprehensive income
Foreign currency translation adjustments 9,894 9,894 5,721 15,615
Unrealized gains on securities, net of reclassification adjustments
176,407 176,407 4,095 180,502
Pension liability adjustments 74,645 74,645 98 74,743
Total comprehensive income 470,402 44,670 515,072
Dividends paid to Toyota Motor Corporation shareholders (172,476) (172,476) (172,476)
Dividends paid to noncontrolling interests (10,732) (10,732)
Purchase and reissuance of common stock 470 470 470
Balances at March 31, 2010 397,050 501,331 11,568,602 (846,835) (1,260,425) 10,359,723 570,720 10,930,443
Equity transaction with noncontrolling interests and other 2,310 2,310 5,183 7,493
Issuance during the year 2,119 2,119 2,119
Comprehensive income
Net income 408,183 408,183 57,302 465,485
Other comprehensive income (loss)
Foreign currency translation adjustments (287,613) (287,613) (11,965) (299,578)
Unrealized losses on securities, net of reclassification adjustments
(26,058) (26,058) (1,599) (27,657)
Pension liability adjustments 15,785 15,785 (4,331) 11,454
Total comprehensive income 110,297 39,407 149,704
Dividends paid to Toyota Motor Corporation shareholders (141,120) (141,120) (141,120)
Dividends paid to noncontrolling interests (27,657) (27,657)
Purchase and reissuance of common stock (958) (958) (958)
Balances at March 31, 2011 ¥397,050 ¥505,760 ¥11,835,665 ¥(1,144,721) ¥(1,261,383) ¥10,332,371 ¥587,653 ¥10,920,024
Toyota Motor Corporation
For the years ended March 31, 2009, 2010 and 2011
The accompanying notes are an integral part of these consolidated financial statements.
72
TOYOTA ANNUAL REPORT 2011