Toyota 2011 Annual Report Download - page 106
Download and view the complete annual report
Please find page 106 of the 2011 Toyota annual report below. You can navigate through the pages in the report by either clicking on the pages listed below, or by using the keyword search tool below to find specific information within the annual report.-
 1
1 -
2
-
3
-
4
-
5
-
6
-
7
-
8
-
9
-
10
-
11
-
12
-
13
-
14
-
15
-
16
-
17
-
18
-
19
-
20
-
21
-
22
-
23
-
24
-
25
-
26
-
27
-
28
-
29
-
30
-
31
-
32
-
33
-
34
-
35
-
36
-
37
-
38
-
39
-
40
-
41
-
42
-
43
-
44
-
45
-
46
-
47
-
48
-
49
-
50
-
51
-
52
-
53
-
54
-
55
-
56
-
57
-
58
-
59
-
60
-
61
-
62
-
63
-
64
-
65
-
66
-
67
-
68
-
69
-
70
-
71
-
72
-
73
-
74
-
75
-
76
-
77
-
78
-
79
-
80
-
81
-
82
-
83
-
84
-
85
-
86
-
87
-
88
-
89
-
90
-
91
-
92
-
93
-
94
-
95
-
 96
96 -
 97
97 -
 98
98 -
 99
99 -
 100
100 -
 101
101 -
 102
102 -
 103
103 -
 104
104 -
 105
105 -
 106
106 -
 107
107 -
 108
108 -
 109
109 -
 110
110 -
 111
111 -
 112
112 -
 113
113
 |
 |

0822
Financial Section and
Investor Information
Business and
Performance Review
Special FeatureMessage/Vision
Management and
Corporate Information
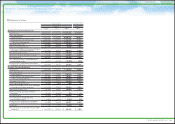
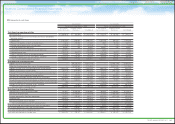
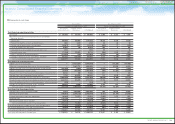
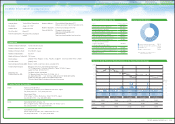
Notes to Consolidated Financial Statements
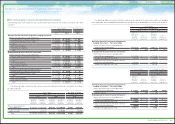
Statements of cash flows
Yen in millions U.S. dollars in millions
For the year ended March 31, 2011 For the year ended March 31, 2011
Non-Financial
Services Businesses
Financial Services
Businesses Consolidated
Non-Financial
Services Businesses
Financial Services
Businesses Consolidated
Cash flows from operating activities
Net income ¥ 241,448 ¥ 226,322 ¥ 465,485 $ 2,904 $ 2,722 $ 5,598
Adjustments to reconcile net income to net cash provided by
operating activities
Depreciation 844,708 330,865 1,175,573 10,159 3,979 14,138
Provision for doubtful accounts and credit losses 1,806 2,334 4,140 22 28 50
Pension and severance costs, less payments (24,867) 1,453 (23,414) (299) 17 (282)
Losses on disposal of fixed assets 36,076 138 36,214 434 2 436
Unrealized losses on available-for-sale securities, net 7,915 — 7,915 95 — 95
Deferred income taxes (17,258) 103,035 85,710 (208) 1,239 1,031
Equity in earnings of affiliated companies (214,229) (787) (215,016) (2,576) (10) (2,586)
Changes in operating assets and liabilities, and other 591,378 (106,416) 487,402 7,112 (1,279) 5,862
Net cash provided by operating activities 1,466,977 556,944 2,024,009 17,643 6,698 24,342
Cash flows from investing activities
Additions to finance receivables — (14,323,261) (8,438,785) — (172,258) (101,488)
Collection of and proceeds from sales of finance receivables — 13,887,751 8,003,940 — 167,020 96,259
Additions to fixed assets excluding equipment leased to others (621,302) (8,024) (629,326) (7,472) (97) (7,569)
Additions to equipment leased to others (78,559) (983,306) (1,061,865) (945) (11,825) (12,770)
Proceeds from sales of fixed assets excluding equipment leased to others
50,742 600 51,342 611 7 618
Proceeds from sales of equipment leased to others 17,700 468,995 486,695 213 5,640 5,853
Purchases of marketable securities and security investments (4,063,499) (358,308) (4,421,807) (48,870) (4,309) (53,179)
Proceeds from sales of and maturity of marketable securities and security investments
3,423,618 292,538 3,716,156 41,174 3,518 44,692
Payment for additional investments in affiliated companies, net of cash acquired
(299) — (299) (4) — (4)
Changes in investments and other assets, and other 394,479 18,303 177,605 4,744 221 2,136
Net cash used in investing activities (877,120) (1,004,712) (2,116,344) (10,549) (12,083) (25,452)
Cash flows from financing activities
Proceeds from issuance of long-term debt 15,318 2,934,588 2,931,436 184 35,293 35,255
Payments of long-term debt (309,862) (2,306,139) (2,489,632) (3,727) (27,735) (29,942)
Increase (decrease) in short-term borrowings (86,884) 122,619 162,260 (1,045) 1,475 1,951
Dividends paid (141,120) — (141,120) (1,697) — (1,697)
Purchase of common stock, and other (28,617) — (28,617) (344) — (344)
Net cash provided by (used in) financing activities (551,165) 751,068 434,327 (6,629) 9,033 5,223
Effect of exchange rate changes on cash and cash equivalents (76,960) (50,069) (127,029) (926) (602) (1,528)
Net increase (decrease) in cash and cash equivalents (38,268) 253,231 214,963 (461) 3,046 2,585
Cash and cash equivalents at beginning of year 1,338,821 526,925 1,865,746 16,102 6,337 22,439
Cash and cash equivalents at end of year ¥ 1,300,553 ¥ 780,156 ¥ 2,080,709 $ 15,641 $ 9,383 $ 25,024
106
TOYOTA ANNUAL REPORT 2011