Toyota 2011 Annual Report Download - page 85
Download and view the complete annual report
Please find page 85 of the 2011 Toyota annual report below. You can navigate through the pages in the report by either clicking on the pages listed below, or by using the keyword search tool below to find specific information within the annual report.-
 1
1 -
2
-
3
-
4
-
5
-
6
-
7
-
8
-
9
-
10
-
11
-
12
-
13
-
14
-
15
-
16
-
17
-
18
-
19
-
20
-
21
-
22
-
23
-
24
-
25
-
26
-
27
-
28
-
29
-
30
-
31
-
32
-
33
-
34
-
35
-
36
-
37
-
38
-
39
-
40
-
41
-
42
-
43
-
44
-
45
-
46
-
47
-
48
-
49
-
50
-
51
-
52
-
53
-
54
-
55
-
56
-
57
-
58
-
59
-
60
-
61
-
62
-
63
-
64
-
65
-
66
-
67
-
68
-
69
-
70
-
71
-
72
-
73
-
74
-
 75
75 -
 76
76 -
 77
77 -
 78
78 -
 79
79 -
 80
80 -
 81
81 -
 82
82 -
 83
83 -
 84
84 -
 85
85 -
 86
86 -
 87
87 -
 88
88 -
 89
89 -
 90
90 -
 91
91 -
 92
92 -
 93
93 -
 94
94 -
 95
95 -
96
-
97
-
98
-
99
-
100
-
101
-
102
-
103
-
104
-
105
-
106
-
107
-
108
-
109
-
110
-
111
-
112
-
113
 |
 |

0822
Financial Section and
Investor Information
Business and
Performance Review
Special FeatureMessage/Vision
Management and
Corporate Information
Notes to Consolidated Financial Statements
Yen in millions
U.S. dollars in millions
For the years ended March 31,
For the year
ended March 31,
2009 2010 2011 2011
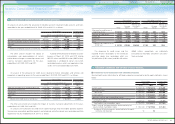
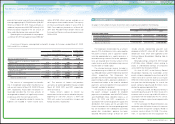
Net revenues ¥23,149,968 ¥20,599,586 ¥21,874,143 $263,068
Gross profit ¥ 2,034,617 ¥ 2,269,109 ¥ 2,342,706 $ 28,174
Net income attributable to affiliated companies
accounted for by the equity method ¥ 13,838 ¥ 317,017 ¥ 641,771 $ 7,718
Entities comprising a significant portion of Toyota’s investment in affiliated companies and percentage
of ownership are presented below:
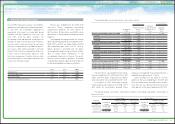
Account balances and transactions with affiliated companies are presented below:
Name of affiliated companies Percentage of ownership
Denso Corporation 24.7%
Aisin Seiki Co., Ltd 23.1%
Toyota Industries Corporation 24.8%
Toyota Tsusho Corporation 21.8%
Toyoda Gosei Co., Ltd 43.1%
Certain affiliated companies accounted for
by the equity method with carrying amounts of
¥1,439,090 million and ¥1,384,159 million ($16,647
million) at March 31, 2010 and 2011, respectively,
were quoted on various established markets at an
aggregate value of ¥1,711,957 million and
¥1,475,352 million ($17,743 million), respectively.
For the year ended March 31, 2010, Toyota
recognized an impairment loss on a certain
investment in affiliated company accounted for
by the equity method of ¥63,575 million, which is
included in “Equity in earnings of affiliated
Dividends from affiliated companies
accounted for by the equity method for the years
ended March 31, 2009, 2010 and 2011 were
¥114,409 million, ¥82,149 million and ¥103,169
million ($1,241 million), respectively.
Toyota does not have any significant related
party transactions other than transactions with
affiliated companies in the ordinary course of
business.
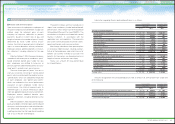
Toyota enters into securitization transactions
using special-purpose entities, that are consid-
ered variable interest entities (“VIEs”). Although
the finance receivables related to securitization
transactions have been legally sold to the VIEs,
Toyota has both the power to direct the activities
of the VIEs that most significantly impact the VIEs’
economic performance and the obligation to
companies” in the accompanying consolidated
statements of income. Toyota evaluated its invest-
ments in affiliated companies, considering the
length of time and the extent to which the quoted
market prices have been less than the carrying
amounts, the financial condition and near-term
prospects of the affiliated companies and Toyota’s
ability and intent to retain those investments in the
companies for a period of time. Toyota did not
recognize any impairment loss for the year ended
March 31, 2011.
absorb losses of the VIEs or the right to receive
benefits from the VIEs that could potentially be
significant to the VIEs. As a result, Toyota is
considered the primary beneficiary of the VIEs
and therefore consolidates the VIEs.
The consolidated securitization VIEs have
¥1,111,212 million ($13,364 million) in retail finance
receivables, ¥64,502 million ($776 million) in
restricted cash and ¥941,613 million ($11,324
million) in secured debt. Risks to which Toyota is
exposed including credit, interest rate, and/or
prepayment risks are not incremental compared
with the situation before Toyota enters into securi-
tization transactions.
As for VIEs other than those specified above,
neither the aggregate size of these VIEs nor
Toyota’s involvements in these VIEs are material
to Toyota’s consolidated financial statements.
Yen in millions
U.S. dollars in millions
March 31, March 31,
2010 2011 2011
Trade accounts and notes receivable, and other receivables ¥274,189 ¥204,447 $2,459
Accounts payable and other payables 597,796 352,538 4,240
Yen in millions
U.S. dollars in millions
For the years ended March 31,
For the year
ended March 31,
2009 2010 2011 2011
Net revenues ¥1,585,814 ¥1,600,365 ¥1,612,397 $19,391
Purchases 3,918,717 3,943,648 3,655,185 43,959
Variable Interest Entities
85TOYOTA ANNUAL REPORT 2011