Toyota 2011 Annual Report Download - page 18
Download and view the complete annual report
Please find page 18 of the 2011 Toyota annual report below. You can navigate through the pages in the report by either clicking on the pages listed below, or by using the keyword search tool below to find specific information within the annual report.-
 1
1 -
2
-
3
-
4
-
5
-
6
-
7
-
 8
8 -
 9
9 -
 10
10 -
 11
11 -
 12
12 -
 13
13 -
 14
14 -
 15
15 -
 16
16 -
 17
17 -
 18
18 -
 19
19 -
 20
20 -
 21
21 -
 22
22 -
 23
23 -
 24
24 -
 25
25 -
 26
26 -
 27
27 -
 28
28 -
29
-
30
-
31
-
32
-
33
-
34
-
35
-
36
-
37
-
38
-
39
-
40
-
41
-
42
-
43
-
44
-
45
-
46
-
47
-
48
-
49
-
50
-
51
-
52
-
53
-
54
-
55
-
56
-
57
-
58
-
59
-
60
-
61
-
62
-
63
-
64
-
65
-
66
-
67
-
68
-
69
-
70
-
71
-
72
-
73
-
74
-
75
-
76
-
77
-
78
-
79
-
80
-
81
-
82
-
83
-
84
-
85
-
86
-
87
-
88
-
89
-
90
-
91
-
92
-
93
-
94
-
95
-
96
-
97
-
98
-
99
-
100
-
101
-
102
-
103
-
104
-
105
-
106
-
107
-
108
-
109
-
110
-
111
-
112
-
113
 |
 |
Business and
Performance Review
Special Feature
Management and
Corporate Information
Financial Section and
Investor InformationMessage/Vision
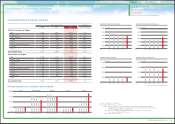
Yen in millions
U.S. dollars*1
in millions % change
2009 2010 2011 2011
2011 vs. 2010
For the Year:
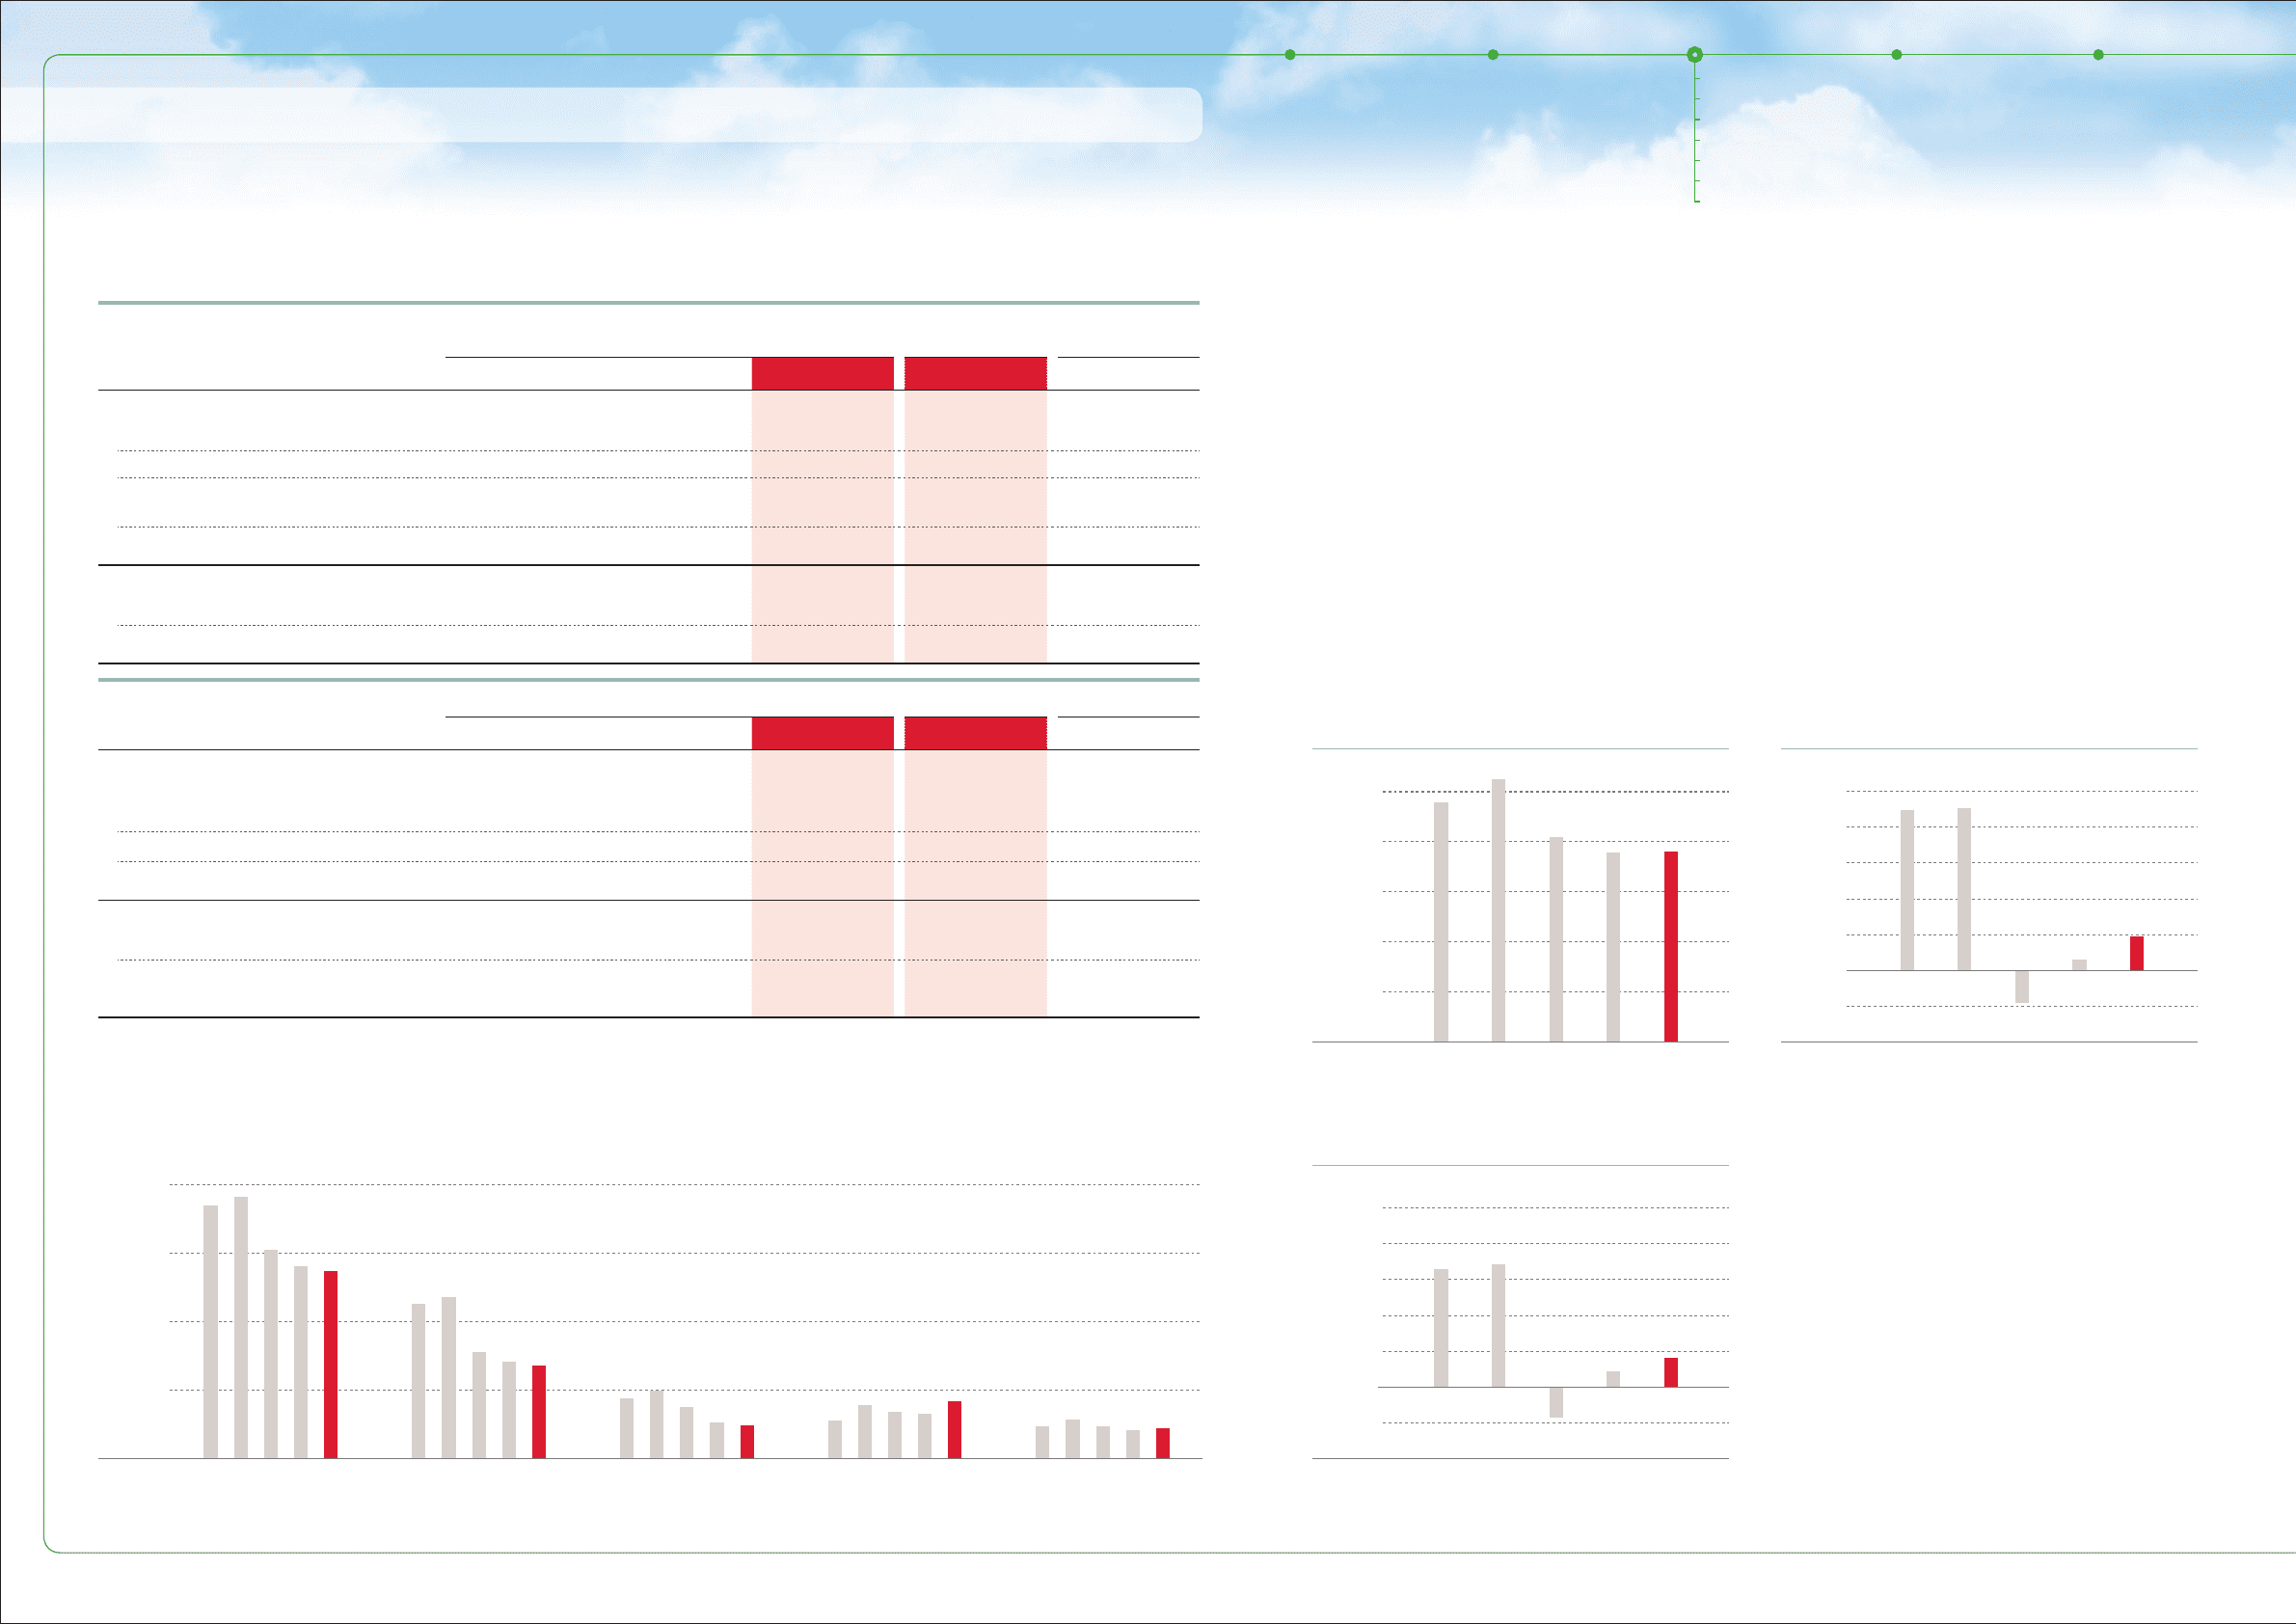
Net Revenues ¥20,529,570 ¥18,950,973 ¥18,993,688 $228,247 +0.2
Operating Income (Loss) (461,011) 147,516 468,279 5,632 +217.4
Net Income (Loss) attributable to
Toyota Motor Corporation*2(436,937) 209,456 408,183 4,909 +94.9
ROE
-
4.0% 2.1% 3.9% — —
At Year-End:
Total Assets ¥29,062,037 ¥30,349,287 ¥29,818,166 $358,607 −1.7
Shareholders’ Equity 10,061,207 10,359,723 10,332,371 124,262 −0.3
Note: Fiscal years ended March 31
Yen U.S. dollars*1% change
2009 2010 2011 2011
2011 vs. 2010
Per Share Data:
Net Income (Loss) attributable to
Toyota Motor Corporation*2¥ (139.13) ¥ 66.79 ¥ 130.17 $ 1.57 +94.9
Annual Cash Dividends 100.00 45.00 50.00 0.60 +11.1
Shareholders' Equity 3,208.41 3,303.49 3,295.08 39.63 −0.3
Stock Information (March 31):
Stock Price ¥ 3,120 ¥ 3,745 ¥ 3,350 $ 40.29 −10.5
Market Capitalization
(Yen in millions, U.S. dollars in millions)
¥10,757,752 ¥12,912,751 ¥11,550,792 $138,915 −10.5
*1: U.S. dollar amounts have been translated at the rate of ¥83.15=US$1, the approximate current exchange rate at March 31, 2011.
*2: “Net Income attributable to Toyota Motor Corporation”, equivalent to “Net Income” up to 2009.
Note: “Net Income attributable to Toyota Motor Corporation”, equivalent to “Net Income” up to 2009.
0
4,000
8,000
12,000
16,000
(¥ Billion)
FY ‘07 ‘11‘10‘09‘08 ‘07 ‘11‘10‘09‘08 ‘07 ‘11‘10‘09‘08 ‘07 ‘11‘10‘09‘08 ‘07 ‘11‘10‘09‘08
Japan North America Europe Asia Other Regions
‘07 ‘11‘10‘09‘08
0
500
-500
1,000
1,500
2,000
2,500
FY
(¥ Billion)
Net Income (Loss) attributable to
Toyota Motor Corporation
0
5,000
10,000
15,000
20,000
25,000
(¥ Billion) (¥ Billion)
FY ‘07 ‘11‘10‘09‘08 ‘07 ‘11‘10‘09‘08
FY
0
500
-500
1,000
1,500
2,000
2,500
Net Revenues Operating Income
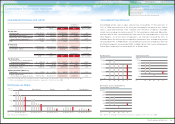
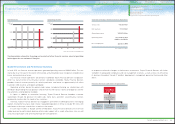
Consolidated Performance Highlights
Consolidated Performance (U.S. GAAP)
Net Revenues by Region
Consolidated Financial Results
0822
Consolidated vehicle sales in Japan and overseas increased by 71 thousand units, or
1.0%, to 7,308 thousand units for the fiscal year compared to the previous year. Vehicle
sales in Japan decreased by 11.5%. However, with the efforts of dealers nationwide,
market share including mini-vehicles was 43.7%, that remained at a high level. Meanwhile,
overseas vehicle sales increased by 6.3%, because of the sales expansion in Asia and
Other Regions. As for the results of operations, net revenues increased by 0.2%, to
¥18,993.6 billion for the fiscal year compared to the previous year, and operating income
increased by 217.4%, to ¥468.2 billion. Income before income taxes and equity in earnings
of affiliated companies increased by 93.3%, to ¥563.2 billion. Net income attributable to
Toyota Motor Corporation increased by 94.9%, to ¥408.1 billion.
Consolidated Performance Highlights
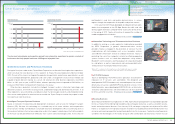
Automotive Operations
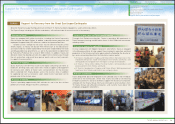
Restore and Renew Our Production Structure for Further Growth
Financial Services Operations
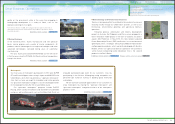
Other Business Operations
New Business Activities
Support for Recovery from the Great East Japan Earthquake
18TOYOTA ANNUAL REPORT 2011