Toyota 2011 Annual Report Download - page 20
Download and view the complete annual report
Please find page 20 of the 2011 Toyota annual report below. You can navigate through the pages in the report by either clicking on the pages listed below, or by using the keyword search tool below to find specific information within the annual report.-
 1
1 -
2
-
3
-
4
-
5
-
6
-
7
-
8
-
9
-
 10
10 -
 11
11 -
 12
12 -
 13
13 -
 14
14 -
 15
15 -
 16
16 -
 17
17 -
 18
18 -
 19
19 -
 20
20 -
 21
21 -
 22
22 -
 23
23 -
 24
24 -
 25
25 -
 26
26 -
 27
27 -
 28
28 -
 29
29 -
 30
30 -
31
-
32
-
33
-
34
-
35
-
36
-
37
-
38
-
39
-
40
-
41
-
42
-
43
-
44
-
45
-
46
-
47
-
48
-
49
-
50
-
51
-
52
-
53
-
54
-
55
-
56
-
57
-
58
-
59
-
60
-
61
-
62
-
63
-
64
-
65
-
66
-
67
-
68
-
69
-
70
-
71
-
72
-
73
-
74
-
75
-
76
-
77
-
78
-
79
-
80
-
81
-
82
-
83
-
84
-
85
-
86
-
87
-
88
-
89
-
90
-
91
-
92
-
93
-
94
-
95
-
96
-
97
-
98
-
99
-
100
-
101
-
102
-
103
-
104
-
105
-
106
-
107
-
108
-
109
-
110
-
111
-
112
-
113
 |
 |
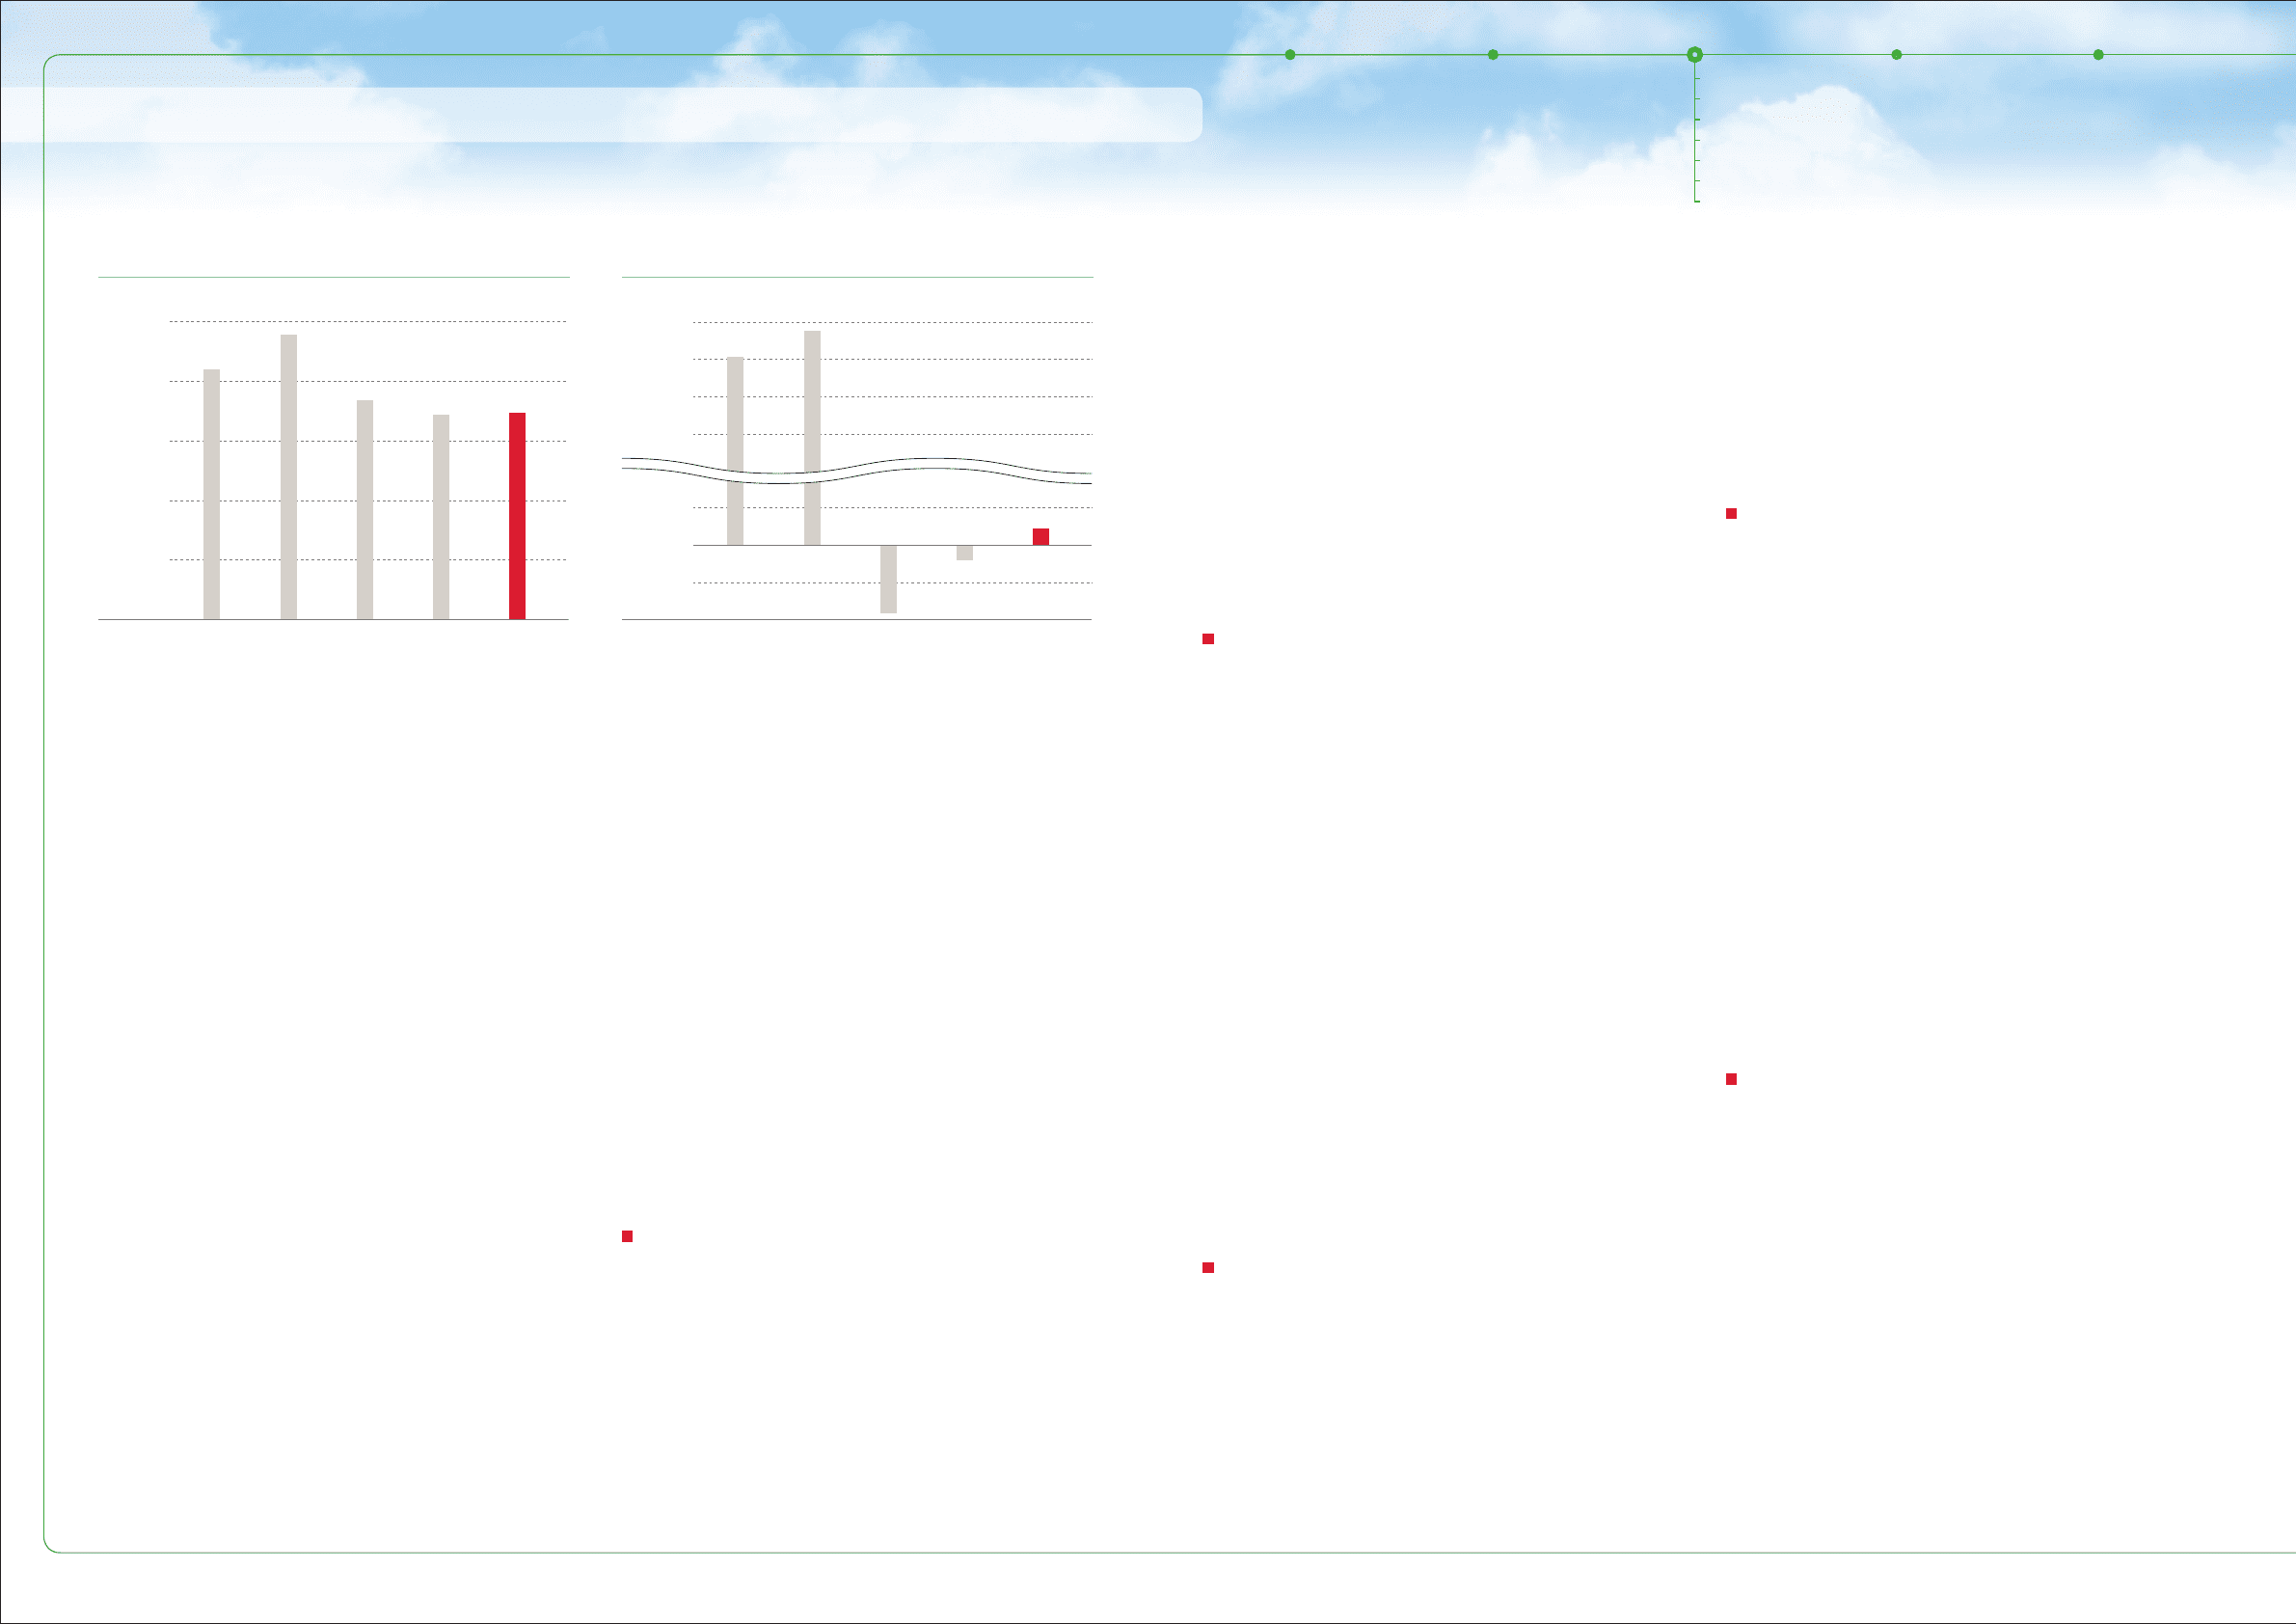
0
5,000
10,000
15,000
20,000
25,000
(¥ Billion)
FY ‘07 ‘11‘10‘09‘08
-200
200
0
-400
1,600
1,800
2,000
2,200
FY ‘07 ‘11‘10
‘09‘08
(¥ Billion)
Business and
Performance Review
Special Feature
Management and
Corporate Information
Financial Section and
Investor InformationMessage/Vision
Automotive Operations (Market Environment and Overview)
Market Environment and Performance Summary
During the fiscal year ended March 31, 2011,
Automotive Operations continued to expand in
China and other emerging markets. The market
was characterized by a transition to small and
low-priced vehicles, in addition to which growing
environmental awareness across the globe
spurred the active development of new
technologies and the introduction of new products.
Within this market environment, consolidated
vehicle sales both in Japan and overseas (including
Daihatsu and Hino) reached 7.31 million units, an
increase of 71 thousand units, or 1%, over the
previous fiscal year. Consolidated vehicle
production also increased, rising by 360 thousand
units, or 5.3% year-on-year, to 7.17 million units.
Due to the rise in both vehicle production and
vehicle sales, net revenues also increased 0.8%
year. Sales of the Lexus brand were at approximately
30 thousand units. Consolidated vehicle production
was down 5.9% year-on-year, to 3.72 million units.
As a result, net revenues were ¥10.99 trillion, a
decrease of ¥234.1 billion or 2.1% year-on-year.
Despite cost-reduction efforts, the impact of
currency exchange fluctuations and decreases in
production and units sold resulted in an operating
loss of ¥362.4 billion, a ¥137.2 billion higher loss
than the previous fiscal year’s operating loss of
¥225.2 billion.
Consolidated vehicle sales in North America in
FY2011 decreased by 67 thousand units, or 3.2%
year-on-year, to 2.03 million units, due to the impact
of a fiercely competitive environment caused by
the introduction of new models by competitors
and other factors. Market share (2010) in the
United States was 15.2%. Sales of the Lexus
brand in North America were at approximately
235 thousand units. Consolidated vehicle
production reached 1.34 million units, a 28.4%
increase year-on-year.
As a result, net revenues were ¥5.43 trillion, a
decrease of ¥241.4 billion or 4.3% year-on-year.
Due to the decrease in the provision for credit
losses of sales finance subsidiaries in the United
States, as well as production increases and cost
reduction efforts, operating income quadrupled
year-on-year, reaching ¥339.5 billion.
Consolidated vehicle sales in Europe during the
period under review declined 7.2%, or 62
thousand units year-on-year, to 796 thousand
units, due to a reduction of demand stimulus
measures by European governments. Toyota’s
European market share (2010; about 40 countries)
was 4.4%. Lexus sales totaled approximately 36
year-on-year to ¥17.34 trillion. Despite the
impact
of currency exchange fluctuations, increased
revenues and cost-reduction efforts resulted in
operating income of ¥86.0 billion, a gain of ¥172.3
billion compared with the previous fiscal year.
Performance by geographic segments was
as follows.
In FY2011, consolidated vehicle sales in Japan
decreased due to weak market conditions
compared with the prior fiscal year, down by 250
thousand units, or 11.5%, to 1.91 million units.
Market share for Toyota and Lexus brands,
excluding minivehicles, was 47.3%, while the share
including minivehicles was 43.7%, indicating a
strong market share continuing from the previous
thousand units.
Consolidated vehicle production declined
14.1% year-on-year, to 372 thousand units.
As a result, net revenues decreased ¥165.6
billion, or 7.7% year-on-year, to ¥1.98 trillion.
Nonetheless, operating income increased ¥46.1
billion year-on-year due to expense reductions.
Consolidated vehicle sales in Asia in FY2011 rose
276 thousand units, or 28.2% year-on-year, to
1.26 million units, due to an overall recovery of the
Asian market led by economic growth in Thailand
and Indonesia. Consolidated vehicle production
also rose 31.6% year-on-year, to 1.34 million units.
As a result, net revenues were ¥3.37 trillion, a
rise of ¥719.2 billion or 27.1% year-on-year.
Operating income also rose due to increased
product and sales units, to ¥313.0 billion, an
increase of ¥109.4 billion or 53.8% year-on-year.
Sales in China, which continues to experience
strong economic growth, reached 846 thousand
units in 2010, a year-on-year increase of 19.3%.
Among these regions, sales in FY2011 grew in
Central and South America, Africa, and the Middle
East, with combined sales reaching 1.31 million
units, an increase of 174 thousand units or 15.3%
year-on-year. Consolidated vehicle production
(Central and South America, Oceania, Africa) was
394 thousand units, an increase of 37 thousand or
10.4% compared with the previous year.
As a result, net revenue reached ¥1.81 trillion, a
year-on-year increase of 8.1% or ¥135.3 billion,
while operating income also increased ¥44.6 billion
or 38.6% year-on-year, reaching ¥160.1 billion.
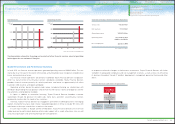
Net Revenues Operating Income
Central and South America, Oceania, Africa,
the Middle East, etc.
* Unit sales figures for China include domestically produced
units as well as units imported from Japan.
Under its founding philosophy of contributing to society through the manufacture of automobiles,
Toyota is dedicated to creating “better cars” that are accepted by our customers and society, and
continues its efforts to manufacture vehicles that meet the needs of countries and regions and
strengthen its initiatives regarding environmentally friendly models.
Note: Fiscal years ended March 31
Japan
North America
Europe
Asia
Consolidated Performance Highlights
Automotive Operations
Restore and Renew Our Production Structure for Further Growth
Financial Services Operations
Other Business Operations
New Business Activities
Support for Recovery from the Great East Japan Earthquake
0822
20
TOYOTA ANNUAL REPORT 2011