Toyota 2011 Annual Report Download - page 91
Download and view the complete annual report
Please find page 91 of the 2011 Toyota annual report below. You can navigate through the pages in the report by either clicking on the pages listed below, or by using the keyword search tool below to find specific information within the annual report.-
 1
1 -
2
-
3
-
4
-
5
-
6
-
7
-
8
-
9
-
10
-
11
-
12
-
13
-
14
-
15
-
16
-
17
-
18
-
19
-
20
-
21
-
22
-
23
-
24
-
25
-
26
-
27
-
28
-
29
-
30
-
31
-
32
-
33
-
34
-
35
-
36
-
37
-
38
-
39
-
40
-
41
-
42
-
43
-
44
-
45
-
46
-
47
-
48
-
49
-
50
-
51
-
52
-
53
-
54
-
55
-
56
-
57
-
58
-
59
-
60
-
61
-
62
-
63
-
64
-
65
-
66
-
67
-
68
-
69
-
70
-
71
-
72
-
73
-
74
-
75
-
76
-
77
-
78
-
79
-
80
-
 81
81 -
 82
82 -
 83
83 -
 84
84 -
 85
85 -
 86
86 -
 87
87 -
 88
88 -
 89
89 -
 90
90 -
 91
91 -
 92
92 -
 93
93 -
 94
94 -
 95
95 -
 96
96 -
 97
97 -
 98
98 -
 99
99 -
 100
100 -
 101
101 -
102
-
103
-
104
-
105
-
106
-
107
-
108
-
109
-
110
-
111
-
112
-
113
 |
 |

Stock-based compensation:
18
0822
Financial Section and
Investor Information
Business and
Performance Review
Special FeatureMessage/Vision
Management and
Corporate Information
Notes to Consolidated Financial Statements
In June 1997, the parent company’s shareholders
approved a stock option plan for board members.
In June 2001, the shareholders approved an
amendment of the plan to include both board
members and key employees. Each year until
June 2010, since the plans’ inception, the
shareholders have approved the authorization for
the grant of options for the purchase of Toyota’s
common stock. Authorized shares for each year
that remain ungranted are unavailable for grant in
future years. Stock options granted in and after
August 2002 have terms ranging from 6 years to
8 years and an exercise price equal to 1.025
times the closing price of Toyota’s common stock
on the date of grant. These options generally vest
2 years from the date of grant.
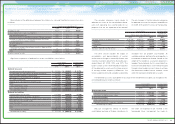
The total intrinsic value of options exercised for
the years ended March 31, 2009 and 2010 was ¥97
million and ¥113 million, respectively. No options
were exercised for the year ended March 31, 2011.
As of March 31, 2011, there were unrecog-
nized compensation expenses of ¥1,693 million
($20 million) for stock options granted. Those
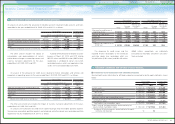
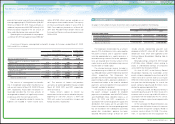
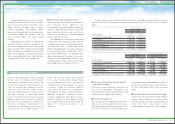
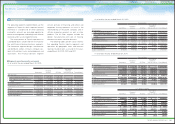
The following table summarizes information for options outstanding and options exercisable at
March 31, 2011:
For the years ended March 31, 2009, 2010
and 2011, Toyota recognized stock-based
compensation expenses for stock options of
¥3,015 million, ¥2,446 million and ¥2,522 million
($30 million) as selling, general and administrative
expenses.
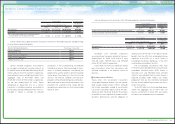
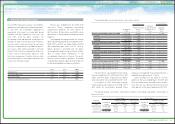
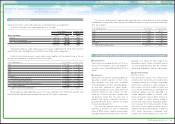
The weighted-average grant-date fair value of
options granted during the years ended March 31,
2009, 2010 and 2011 was ¥635, ¥803 and ¥724
($9), respectively per share. The fair value of
options granted is amortized over the option
vesting period in determining net income attribut-
able to Toyota Motor Corporation in the
consolidated statements of income. The grant-
date fair value of options granted is estimated
using the Black-Scholes option pricing model with
the following weighted-average assumptions:
expenses are expected to be recognized over a
weighted-average period of 1.1 years.
Cash received from the exercise of stock
options for the years ended March 31, 2009 and
2010 was ¥435 million and ¥492 million, respec-
tively. No cash was received from the exercise of
stock options for the year ended March 31, 2011.
2009 2010 2011
Dividend rate 3.0% 2.4% 1.5%
Risk-free interest rate 1.1% 0.7% 0.3%
Expected volatility 23% 30% 32%
Expected holding period (years) 5.0 5.0 5.0
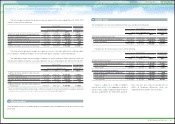
Yen Yen in millions
Number of
shares
Weighted-average
exercise
price
Weighted-
average remaining
contractual life in
years
Aggregate
intrinsic
value
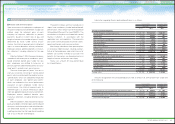
Options outstanding at March 31, 2008 8,341,600 ¥6,038 5.71 ¥1,753
Granted 3,494,000 4,726
Exercised (119,900) 3,626
Canceled (375,000) 6,889
Options outstanding at March 31, 2009 11,340,700 5,631 5.51 ¥ 1
Granted 3,492,000 4,193
Exercised (157,800) 3,116
Canceled (958,200) 4,646
Options outstanding at March 31, 2010 13,716,700 5,363 5.23 ¥ —
Granted 3,435,000 3,183
Exercised — —
Canceled (1,364,900) 4,759
Options outstanding at March 31, 2011 15,786,800 ¥4,941 5.04 ¥ 565
Options exercisable at March 31, 2009 4,971,700 ¥5,302 3.76 ¥ 1
Options exercisable at March 31, 2010 7,515,700 ¥6,132 3.86 ¥ —
Options exercisable at March 31, 2011 9,347,800 ¥5,821 3.79 ¥ —
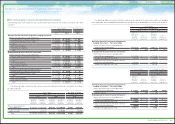
The following table summarizes Toyota’s stock option activity:
Outstanding Exercisable
Exercise
price range Number of
shares
Weighted-average
exercise price
Weighted-average
remaining life
Number of
shares
Weighted-average
exercise price
Yen Yen Dollars Years Yen Dollars
¥3,183-6,000 10,508,800 ¥4,030 $48 5.63 4,069,800 ¥4,611 $55
6,001-7,278 5,278,000 6,754 81 3.87 5,278,000 6,754 81
3,183-7,278 15,786,800 4,941 59 5.04 9,347,800 5,821 70
91
TOYOTA ANNUAL REPORT 2011