Toyota 2011 Annual Report Download - page 52
Download and view the complete annual report
Please find page 52 of the 2011 Toyota annual report below. You can navigate through the pages in the report by either clicking on the pages listed below, or by using the keyword search tool below to find specific information within the annual report.-
 1
1 -
2
-
3
-
4
-
5
-
6
-
7
-
8
-
9
-
10
-
11
-
12
-
13
-
14
-
15
-
16
-
17
-
18
-
19
-
20
-
21
-
22
-
23
-
24
-
25
-
26
-
27
-
28
-
29
-
30
-
31
-
32
-
33
-
34
-
35
-
36
-
37
-
38
-
39
-
40
-
41
-
 42
42 -
 43
43 -
 44
44 -
 45
45 -
 46
46 -
 47
47 -
 48
48 -
 49
49 -
 50
50 -
 51
51 -
 52
52 -
 53
53 -
 54
54 -
 55
55 -
 56
56 -
 57
57 -
 58
58 -
 59
59 -
 60
60 -
 61
61 -
 62
62 -
63
-
64
-
65
-
66
-
67
-
68
-
69
-
70
-
71
-
72
-
73
-
74
-
75
-
76
-
77
-
78
-
79
-
80
-
81
-
82
-
83
-
84
-
85
-
86
-
87
-
88
-
89
-
90
-
91
-
92
-
93
-
94
-
95
-
96
-
97
-
98
-
99
-
100
-
101
-
102
-
103
-
104
-
105
-
106
-
107
-
108
-
109
-
110
-
111
-
112
-
113
 |
 |
0822
Financial Section and
Investor Information
Business and
Performance Review
Special FeatureMessage/Vision
Management and
Corporate Information
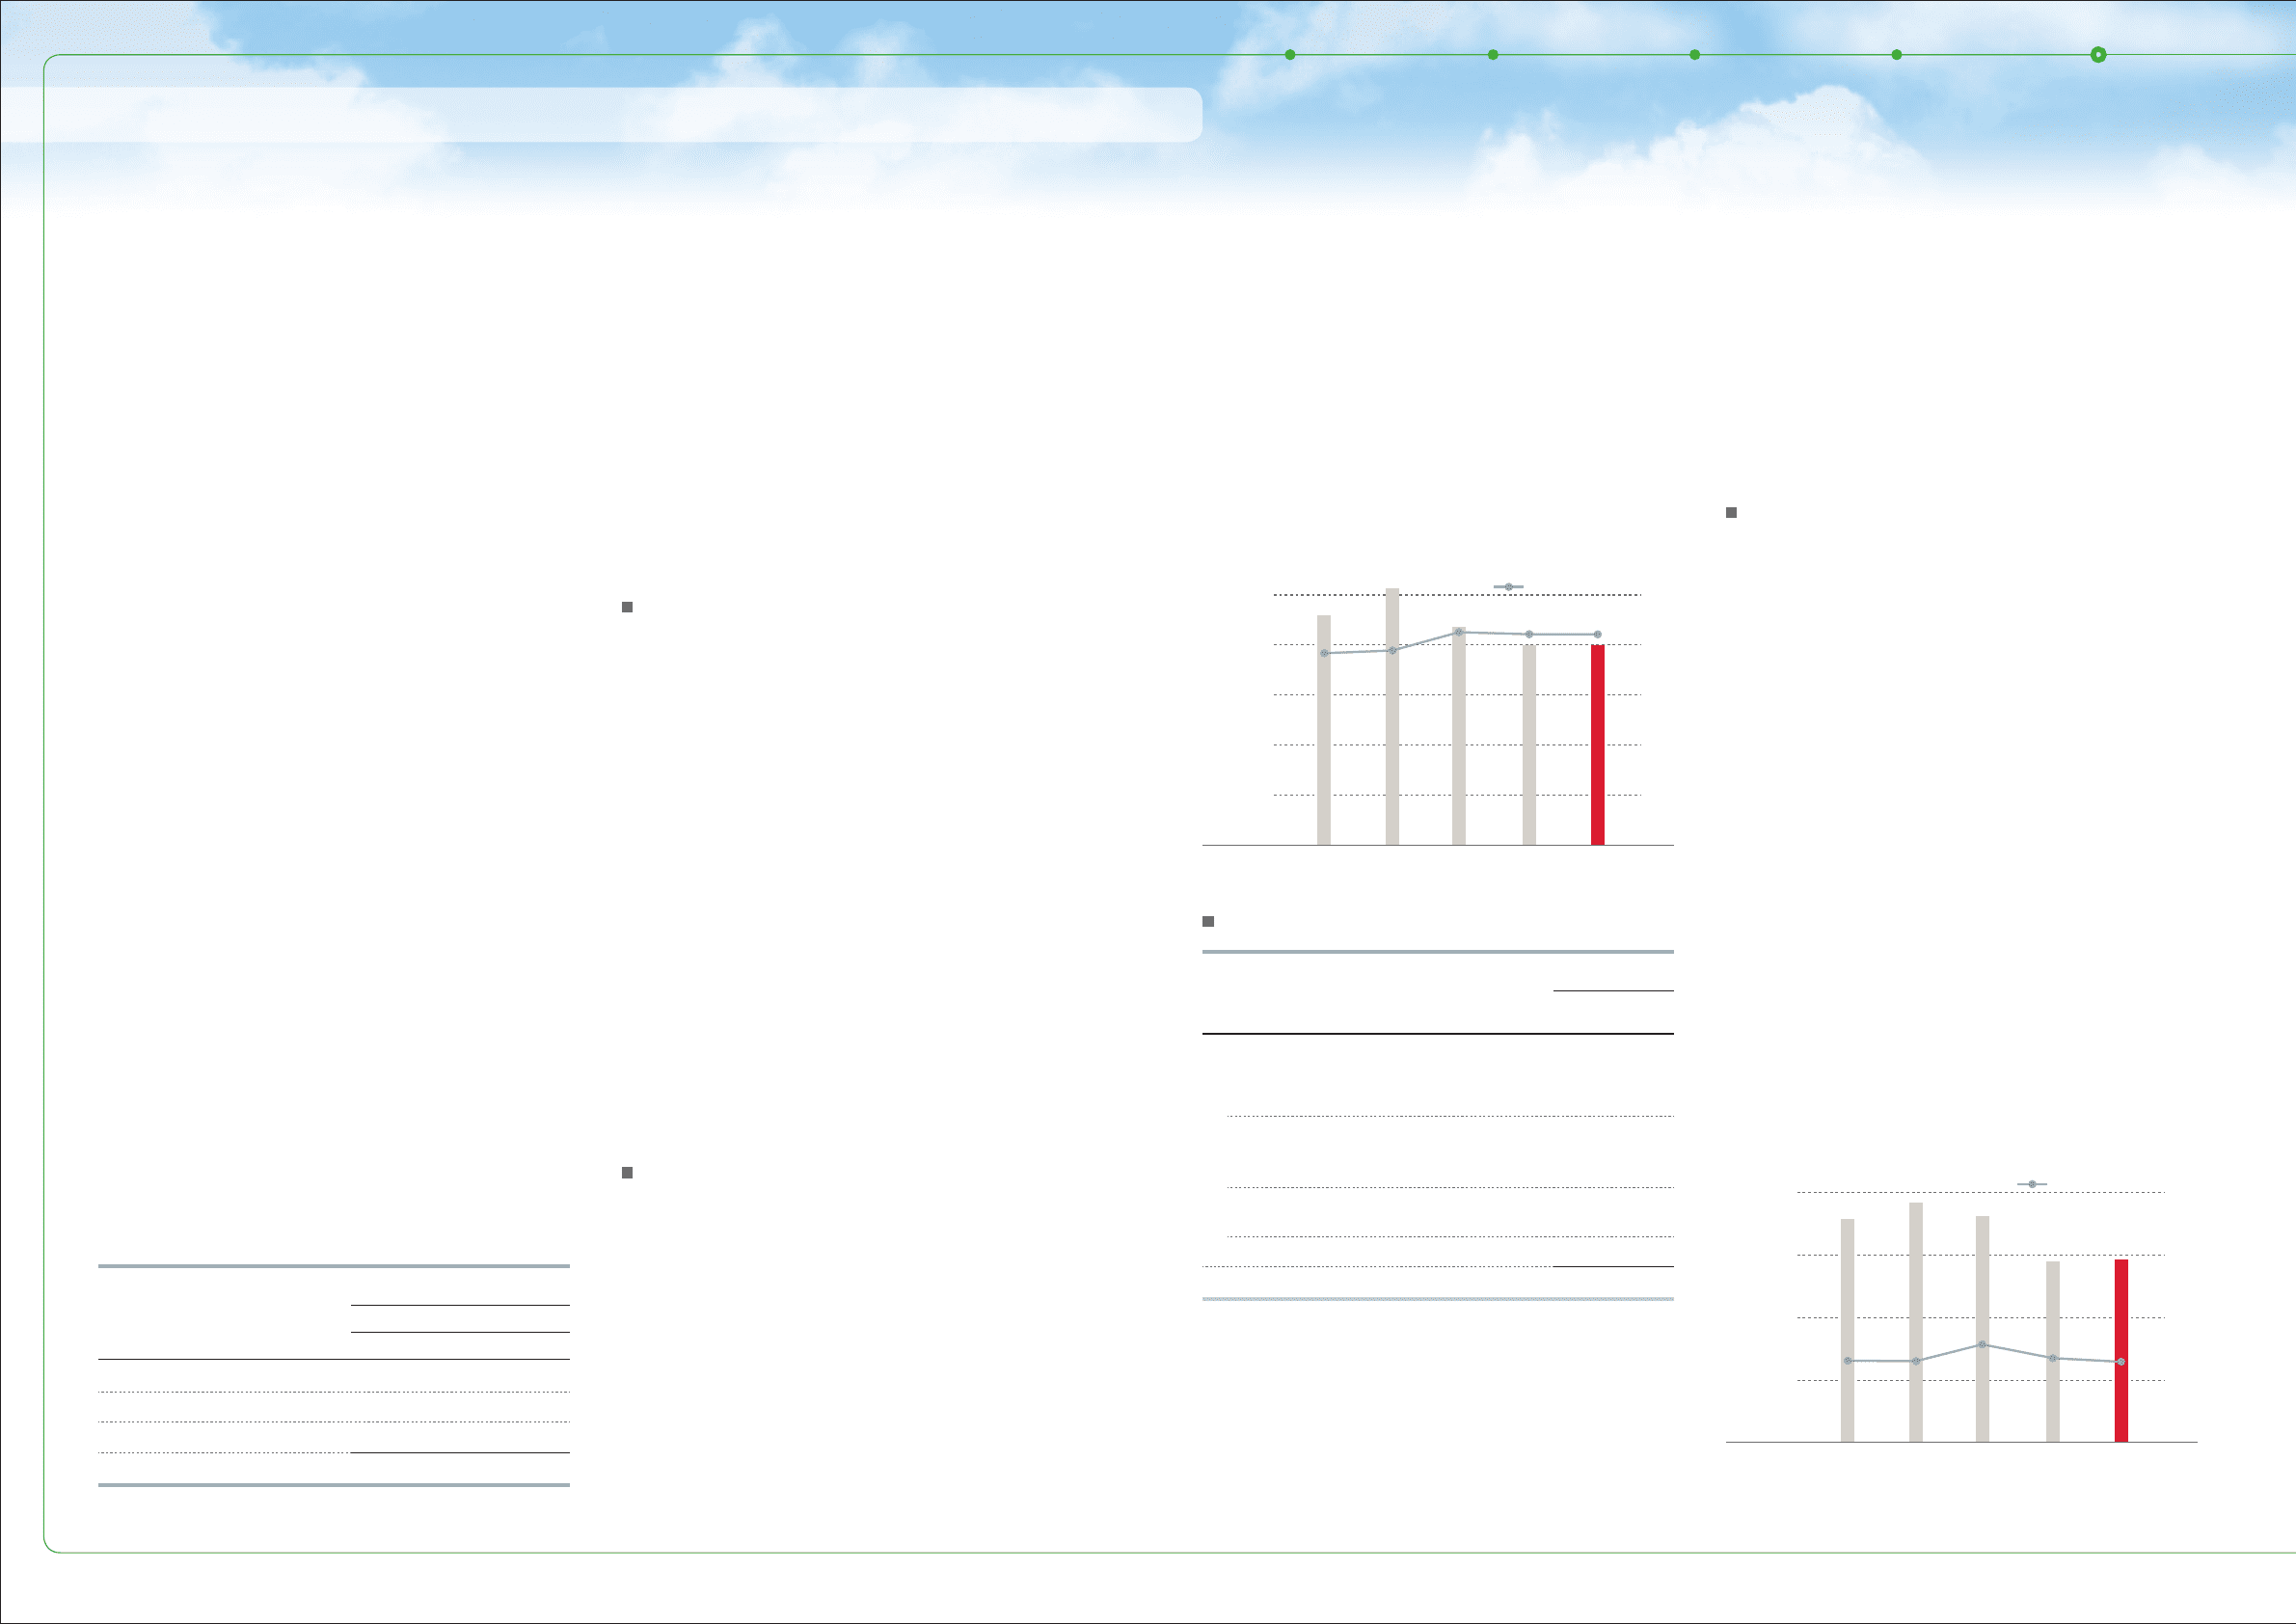
Cost of products sold increased by ¥14.3 billion, or
0.1%, to ¥15,985.8 billion during fiscal 2011
compared with the prior fiscal year. The increase
resulted from the ¥520.0 billion impact of increase
in vehicle unit sales and changes in sales mix,
¥90.0 billion increase in miscellaneous costs, and
the ¥13.9 billion impact of increases in parts sales,
partially offset by the ¥584.9 billion favorable impact
of fluctuations in foreign currency translation rates,
and the ¥180.0 billion impact of cost reduction
efforts. The increase in miscellaneous costs was
due mainly to the ¥30.0 billion increase in costs
related to quality initiatives, the ¥25.0 billion increase
in research and development expenses and the
¥5.2 billion increase in labor costs. The increase in
vehicle unit sales and the changes in sales mix was
due to the automotive market recovery associated
with global economic turnaround.
Electronic Control Modules (ECMs). The affected
vehicle models included Corolla and Matrix, and
1,360 thousand vehicles were included in this
recall.
In October 2010, Toyota announced in Japan
and other regions the voluntary safety recall of
certain models of Toyota and Lexus brands’
vehicles related to the connector terminal that may
fail due to the inflexibility of the material of the fuel
pump wiring harness and braking performance
that may gradually decline by brake fluid leakage
from the brake master cylinder. The affected
vehicle models included Crown, Crown Majesta,
Mark X, KlugerL, KlugerV, Harrier, AlphardG,
AlphardV, Avalon, Highlander, RX330, GS300,
GS350, IS250, IS350, and IS220D, and 1,470
thousand vehicles were included in this recall.
In January 2011, Toyota announced in Japan
and other regions the voluntary safety recall of
certain models of Toyota and Lexus brands’
vehicles to address fuel leakage that may result
from improper manufacturing of engine fuel pipe
and fuel pump. The affected vehicle models
included Noah, Voxy, RAV4L, RAV4J, Caldina,
Isis, Vista, Vista Ardeo, Opa, Premio, Allion, Gaia,
Nadia, WISH, Avensis, and Avensis Wagon and
1,343 thousand vehicles were included in this
recall.
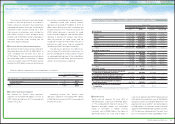
The net changes in fiscal 2010 and 2011 in
the accrual for the four recalls and other safety
measures that occurred in fiscal 2010 are shown
below.
Toyota expanded the coverage of a safety
campaign in North America for certain models of
Toyota and Lexus brands’ vehicles related to floor
mat entrapment of accelerator pedals to include
additional models, which was initially announced
in November 2009. In March 2011, Toyota also
expanded the safety campaign coverage to
include more models to heighten the level of
reassurance for customers. The vehicle models
involved were LX570, RAV4, and 4Runner.
During fiscal 2011, continued cost reduction efforts
reduced operating costs and expenses by ¥180.0
billion. The effect of cost reduction efforts include
the impact of fluctuation in the price of steel, precious
metals, non-ferrous alloys including aluminum,
plastic parts and other production materials and
parts. In fiscal 2011, raw materials prices were on an
increasing trend; however, continued cost reduction
efforts, by working closely with suppliers, contributed
to the improvement in earnings by offsetting the
effects from price increase. These cost reduction
efforts related to ongoing value engineering and
value analysis activities, the use of common parts
resulting in a reduction of part types and other
manufacturing initiatives designed to reduce the
costs of vehicle production.
Management's Discussion and Analysis of Financial Condition and Results of Operations
Cost of Products Sold
Cost of Financing Operations
0 0
4,000
8,000
12,000
16,000
20,000 100
80
60
40
20
FY ‘07 ‘11‘10‘09‘08
(%)
% of net revenues
(Right scale)
(¥ Billion)
Cost of Products Sold
Cost of financing operations decreased by ¥82.8
billion, or 11.6%, to ¥629.5 billion during fiscal 2011
compared with the prior fiscal year. The decrease
resulted from the ¥64.7 billion favorable impact of
fluctuations in foreign currency translation rates,
the ¥30.0 billion decrease in provision for residual
value losses and the ¥6.4 billion recognition of
valuation gains on interest rate swaps stated at fair
value. The decrease in provision for residual value
losses is attributable to prices in the used vehicles
markets remaining at an unprecedented high level
particularly in the United States.
Selling, general and administrative expenses
decreased by ¥209.5 billion, or 9.9%, to ¥1,910.1
billion during fiscal 2011 compared with the prior
fiscal year. This decrease reflects the ¥115.5
billion favorable impact of fluctuations in foreign
currency translation rates and the ¥83.9 billion
decrease for the financial services operations.
This decrease for the financial services operations
includes the ¥100.0 billion decrease in provision
for credit losses and net charge-offs, which is
attributable to the prices of used vehicles
remaining at an unprecedented high level mainly
in the United States and the prices of used Toyota
and Lexus brands’ vehicles also remaining at a
high level, partially offset by the ¥15.0 billion
increase in provision for credit losses and
charge-offs in relation to the Great East Japan
Earthquake.
Yen in millions
2011 vs. 2010
Change
Changes in cost of financing operations:
Effect of fluctuation in foreign
currency translation rates ¥(64,700)
Effect of increase in valuation gains
on interest rate swaps stated at
fair value (6,400)
Effect of decrease in provision for
residual value losses (30,000)
Other 18,342
Total ¥(82,758)
Selling, General and Administrative Expenses
0 0
250
500
750
1,000 12
9
6
3
‘07 ‘11‘10‘09‘08
FY
(¥ Billion)
(%)
% of net revenues
(Right scale)
R&D Expenses
Cost Reduction Efforts
Yen in millions
Year ended March 31,
2010 2011
Balance at the beginning of year
¥ — ¥ 56,600
Accrual 89,000 13,100
Amounts paid
(32,400) (51,700)
Balance at the end of year ¥ 56,600 ¥ 18,000
52
TOYOTA ANNUAL REPORT 2011