Toyota 2011 Annual Report Download - page 55
Download and view the complete annual report
Please find page 55 of the 2011 Toyota annual report below. You can navigate through the pages in the report by either clicking on the pages listed below, or by using the keyword search tool below to find specific information within the annual report.-
 1
1 -
2
-
3
-
4
-
5
-
6
-
7
-
8
-
9
-
10
-
11
-
12
-
13
-
14
-
15
-
16
-
17
-
18
-
19
-
20
-
21
-
22
-
23
-
24
-
25
-
26
-
27
-
28
-
29
-
30
-
31
-
32
-
33
-
34
-
35
-
36
-
37
-
38
-
39
-
40
-
41
-
42
-
43
-
44
-
 45
45 -
 46
46 -
 47
47 -
 48
48 -
 49
49 -
 50
50 -
 51
51 -
 52
52 -
 53
53 -
 54
54 -
 55
55 -
 56
56 -
 57
57 -
 58
58 -
 59
59 -
 60
60 -
 61
61 -
 62
62 -
 63
63 -
 64
64 -
 65
65 -
66
-
67
-
68
-
69
-
70
-
71
-
72
-
73
-
74
-
75
-
76
-
77
-
78
-
79
-
80
-
81
-
82
-
83
-
84
-
85
-
86
-
87
-
88
-
89
-
90
-
91
-
92
-
93
-
94
-
95
-
96
-
97
-
98
-
99
-
100
-
101
-
102
-
103
-
104
-
105
-
106
-
107
-
108
-
109
-
110
-
111
-
112
-
113
 |
 |

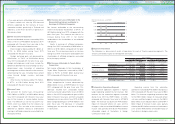
Results of Operations — Fiscal 2010 Compared with Fiscal 2009
0822
Financial Section and
Investor Information
Business and
Performance Review
Special FeatureMessage/Vision
Management and
Corporate Information
Management's Discussion and Analysis of Financial Condition and Results of Operations
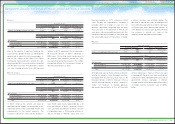
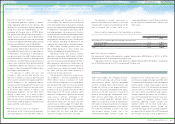
Yen in millions
Year ended March 31, 2010 vs. 2009 Change
2009 2010 Amount Percentage
Net revenues:
Japan ¥12,186,737 ¥11,220,303 ¥ (966,434) −7.9%
North America 6,222,914 5,670,526 (552,388) −8.9%
Europe 3,013,128 2,147,049 (866,079) −28.7%
Asia 2,719,329 2,655,327 (64,002) −2.4%
Other* 1,882,900 1,673,861 (209,039) −11.1%
Intersegment elimination/unallocated amount
(5,495,438) (4,416,093) 1,079,345 —
Total ¥20,529,570 ¥18,950,973 ¥(1,578,597) −7.7%
Operating income (loss):
Japan ¥ (237,531) ¥ (225,242) ¥ 12,289 —
North America (390,192) 85,490 475,682 —
Europe (143,233) (32,955) 110,278 —
Asia 176,060 203,527 27,467 +15.6%
Other* 87,648 115,574 27,926 +31.9%
Intersegment elimination/unallocated amount
46,237 1,122 (45,115) −97.6%
Total ¥ (461,011) ¥ 147,516 ¥ 608,527 —
Operating margin −2.2% 0.8% 3.0%
Income (loss) before income taxes and equity
in earnings of affiliated companies (560,381) 291,468 851,849 —
Net margin from income (loss) before income taxes
and equity in earnings of affiliated companies
−2.7% 1.5% 4.2%
Equity in earnings of affiliated companies 42,724 45,408 2,684 +6.3%
Net income (loss) attributable to Toyota
Motor Corporation (436,937) 209,456 646,393 —
Net margin attributable to Toyota Motor
Corporation −2.1% 1.1% 3.2%
Toyota had net revenues for fiscal 2010 of
¥18,950.9 billion, a decrease of ¥1,578.6 billion,
or 7.7%, compared with the prior fiscal year. This
decrease principally reflects the unfavorable
impact of fluctuations in foreign currency
translation rates of ¥986.9 billion, the impact of
decreased vehicle unit sales and changes in
sales mix of approximately ¥570.0 billion, partially
offset by the increased parts sales of ¥34.9 billion
during fiscal 2010. Excluding the difference in the
Japanese yen value used for translation purposes
of ¥986.9 billion, net revenues would have been
approximately ¥19,937.8 billion during fiscal 2010,
a 2.9% decrease compared with the prior fiscal
year. The automotive market expanded by 10.0%
Net Revenues
* “Other” consists of Central and South America, Oceania and Africa.
The increase in vehicle unit sales and changes
in sales mix was due primarily to an increase in
Toyota’s vehicle unit sales by 71 thousand vehicles
compared with the prior fiscal year, favored by the
automotive market recovery during fiscal 2011.
The increase in miscellaneous costs includes the
¥30.0 billion increase in costs related to quality
initiatives and the ¥5.0 billion impact of damages in
inventories and other assets resulting from the
Great East Japan Earthquake.
Net revenues for the financial services operations
decreased during fiscal 2011 by ¥53.2 billion, or
4.3%, compared with the prior fiscal year to
¥1,192.2 billion. This decrease was primarily due to
the unfavorable impact of fluctuations in foreign
currency translation rates of ¥77.5 billion, partially
offset by the ¥13.1 billion increase in rental income
from vehicles and equipment on operating leases.
Operating income from financial services
operations increased by ¥111.3 billion, or 45.1%, to
¥358.2 billion during fiscal 2011 compared with
the prior fiscal year. This increase was due to the
¥100.0 billion decrease in provision for credit
losses and net charge-offs, and the ¥30.0 billion
decrease in provision for residual value losses,
while the provision for credit losses and net
charge-offs include the ¥15.0 billion increase in
provision for credit losses and net charge-offs
related to the Great East Japan Earthquake.
The decrease in provisions for credit losses,
net of charge-offs and residual value losses are
primarily attributable to used car prices rising to
an unprecedented high level in the United States
and the prices of used Toyota and Lexus brands’
vehicles also remaining at a high level.
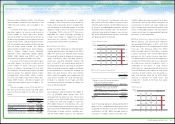
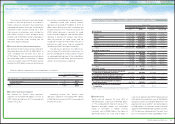
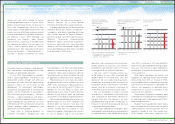
Ratio of credit loss experience in the United States is as follows:
Net revenues for Toyota’s other operations
segments increased by ¥24.6 billion, or 2.6%, to
¥972.2 billion during fiscal 2011 compared with
the prior fiscal year.
Operating income from Toyota’s other
operations segments increased by ¥44.1 billion
to ¥35.2 billion during fiscal 2011 compared with
the prior fiscal year.
Financial Services Operations Segment
All Other Operations Segment
Year ended March 31,
2010 2011
Net charge-offs as a percentage of average gross earning assets:
Finance receivables 1.15% 0.61%
Operating lease 0.63 0.22
Total 1.03% 0.52%
55
TOYOTA ANNUAL REPORT 2011