Toyota 2011 Annual Report Download - page 68
Download and view the complete annual report
Please find page 68 of the 2011 Toyota annual report below. You can navigate through the pages in the report by either clicking on the pages listed below, or by using the keyword search tool below to find specific information within the annual report.-
 1
1 -
2
-
3
-
4
-
5
-
6
-
7
-
8
-
9
-
10
-
11
-
12
-
13
-
14
-
15
-
16
-
17
-
18
-
19
-
20
-
21
-
22
-
23
-
24
-
25
-
26
-
27
-
28
-
29
-
30
-
31
-
32
-
33
-
34
-
35
-
36
-
37
-
38
-
39
-
40
-
41
-
42
-
43
-
44
-
45
-
46
-
47
-
48
-
49
-
50
-
51
-
52
-
53
-
54
-
55
-
56
-
57
-
 58
58 -
 59
59 -
 60
60 -
 61
61 -
 62
62 -
 63
63 -
 64
64 -
 65
65 -
 66
66 -
 67
67 -
 68
68 -
 69
69 -
 70
70 -
 71
71 -
 72
72 -
 73
73 -
 74
74 -
 75
75 -
 76
76 -
 77
77 -
 78
78 -
79
-
80
-
81
-
82
-
83
-
84
-
85
-
86
-
87
-
88
-
89
-
90
-
91
-
92
-
93
-
94
-
95
-
96
-
97
-
98
-
99
-
100
-
101
-
102
-
103
-
104
-
105
-
106
-
107
-
108
-
109
-
110
-
111
-
112
-
113
 |
 |

0822
Financial Section and
Investor Information
Business and
Performance Review
Special FeatureMessage/Vision
Management and
Corporate Information
residual value are still considered reasonable.
Factors affecting the estimated residual value at
lease maturity include, but are not limited to, new
vehicle incentive programs, new vehicle pricing,
used vehicle supply, projected vehicle return
rates, and projected loss severity. The vehicle
return rate represents the number of leased
vehicles returned at contract maturity and sold by
Toyota during the period as a percentage of the
number of lease contracts that, as of their origina-
tion dates, were scheduled to mature in the same
period. A higher rate of vehicle returns exposes
Toyota to higher potential losses incurred at lease
termination. Severity of loss is the extent to which
the end-of-term fair value of a lease is less than its
carrying value at lease end.
To the extent that sales incentives remain an
integral part of sales promotion, resale prices of
used vehicles and, correspondingly, the fair value
of Toyota’s leased vehicles could be subject to
downward pressure. The extent of the impact this
will have on the end of term residual value depends
on the significance of the incentive programs and
whether they are sustained over a number of
periods. This in turn can impact the projection of
future used vehicle values, adversely impacting
the expected residual value of the current
operating lease portfolio and increasing the
provision for residual value losses. However,
various other factors impact used vehicle values
and the projection of future residual values,
including the supply of and demand for used
vehicles, interest rates, inflation, the actual or
perceived quality, safety and reliability of vehicles,
the general economic outlook, new vehicle pricing,
projected vehicle return rates and projected loss
severity, which may offset this effect. Such factors
are highly likely to adversely affect the results of
operations for financial services due to significant
charges reducing the estimated residual value.
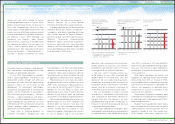
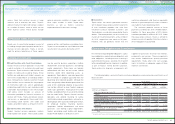
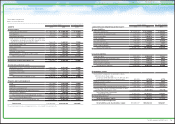
The following table illustrates the effect of an
assumed change in the vehicle return rate and
end-of-term market values, which Toyota believes
are the critical estimates, in determining the
residual value losses, holding all other assump-
tions constant. The following table represents the
impact on the residual value losses in Toyota’s
financial services operations of the change in
vehicle return rate and end-of-term market values
as those changes have a significant impact on
financial services operations.
Toyota periodically reviews the carrying value of
its long-lived assets held and used and assets to
be disposed of, including intangible assets, when
events and circumstances warrant such a review.
This review is performed using estimates of future
cash flows. If the carrying value of a long-lived
asset is considered impaired, an impairment
charge is recorded for the amount by which the
carrying value of the long-lived asset exceeds its
fair value. Management believes that the estimates
of future cash flows and fair values are reason-
able. However, changes in estimates of such
cash flows and fair values would affect the evalua-
tions and negatively affect future operating results
of the automotive operations.
Impairment of Long-Lived Assets
Yen in millions
Effect on the residual
value losses over the
remaining terms of the
operating leases on and
after April 1, 2011
1 percent increase in vehicle
return rate ¥1,164
1 percent increase in end-of-term
market values ¥4,490
Management's Discussion and Analysis of Financial Condition and Results of Operations
Pension costs and obligations are dependent on
assumptions used in calculating such amounts.
These assumptions include discount rates,
benefits earned, interest costs, expected rate of
return on plan assets, mortality rates and other
factors. Actual results that differ from the assump-
tions are accumulated and amortized over future
periods and, therefore, generally affect recognized
expense in future periods. While management
believes that the assumptions used are
appropriate, differences in actual experience or
changes in assumptions may affect Toyota’s
pension costs and obligations.
The two most critical assumptions impacting
the calculation of pension costs and obligations
are the discount rates and the expected rates of
returns on plan assets. Toyota determines the
discount rates mainly based on the rates of high
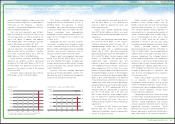
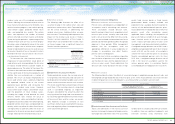
The following table illustrates the effects of assumed changes in weighted-average discount rates and
the weighted-average expected rate of return on plan assets, which Toyota believes are critical estimates
in determining pension costs and obligations, assuming all other assumptions are consistent.
quality fixed income bonds or fixed income
governmental bonds currently available and
expected to be available during the period to
maturity of the defined benefit pension plans.
Toyota determines the expected rates of return for
pension assets after considering several
applicable factors including, the composition of
plan assets held, assumed risks of asset manage-
ment, historical results of the returns on plan
assets, Toyota’s principal policy for plan asset
management, and forecasted market conditions.
A weighted-average discount rate of 2.8% and a
weighted-average expected rate of return on plan
assets of 3.8% are the results of assumptions
used for the various pension plans in calculating
Toyota’s consolidated pension costs for fiscal
2011. Also, a weighted-average discount rate of
2.8% is the result of assumption used for the
various pension plans in calculating Toyota’s
consolidated pension obligations for fiscal 2011.
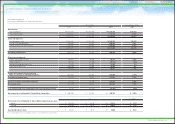
Sensitivity analysis
Yen in millions
Effect on pre-tax income for
the year ended March 31, 2012 Effect on PBO
as of March 31, 2011
Discount rates
0.5% decrease ¥(10,325) ¥ 124,789
0.5% increase 9,845 (115,671)
Expected rate of return on plan assets
0.5% decrease ¥ (5,917)
0.5% increase 5,917
Pension Costs and Obligations
Natures of estimates and assumptions
Sensitivity analysis
Toyota uses derivatives in the normal course of
business to manage its exposure to foreign currency
exchange rates and interest rates. The accounting
for derivatives is complex and continues to evolve.
In addition, there are significant judgments and
estimates involved, using information from
Derivatives and Other Contracts at Fair Value
68TOYOTA ANNUAL REPORT 2011