Toyota 2011 Annual Report Download - page 57
Download and view the complete annual report
Please find page 57 of the 2011 Toyota annual report below. You can navigate through the pages in the report by either clicking on the pages listed below, or by using the keyword search tool below to find specific information within the annual report.-
 1
1 -
2
-
3
-
4
-
5
-
6
-
7
-
8
-
9
-
10
-
11
-
12
-
13
-
14
-
15
-
16
-
17
-
18
-
19
-
20
-
21
-
22
-
23
-
24
-
25
-
26
-
27
-
28
-
29
-
30
-
31
-
32
-
33
-
34
-
35
-
36
-
37
-
38
-
39
-
40
-
41
-
42
-
43
-
44
-
45
-
46
-
 47
47 -
 48
48 -
 49
49 -
 50
50 -
 51
51 -
 52
52 -
 53
53 -
 54
54 -
 55
55 -
 56
56 -
 57
57 -
 58
58 -
 59
59 -
 60
60 -
 61
61 -
 62
62 -
 63
63 -
 64
64 -
 65
65 -
 66
66 -
 67
67 -
68
-
69
-
70
-
71
-
72
-
73
-
74
-
75
-
76
-
77
-
78
-
79
-
80
-
81
-
82
-
83
-
84
-
85
-
86
-
87
-
88
-
89
-
90
-
91
-
92
-
93
-
94
-
95
-
96
-
97
-
98
-
99
-
100
-
101
-
102
-
103
-
104
-
105
-
106
-
107
-
108
-
109
-
110
-
111
-
112
-
113
 |
 |

0822
Financial Section and
Investor Information
Business and
Performance Review
Special FeatureMessage/Vision
Management and
Corporate Information
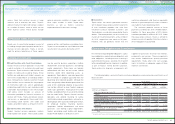
Management's Discussion and Analysis of Financial Condition and Results of Operations
Thousands of units
Year ended March 31, 2010 vs. 2009 Change
2009 2010 Amount Percentage
Toyota’s consolidated vehicle unit sales 1,062 858 (204) −19.2%
Yen in millions
Year ended March 31, 2010 vs. 2009 Change
2009 2010 Amount Percentage
Net revenues:
Sales of products ¥2,911,234 ¥2,065,768 ¥(845,466) −29.0%
Financial services 101,894 81,281 (20,613) −20.2%
Total ¥3,013,128 ¥2,147,049 ¥(866,079) −28.7%
Europe
Thousands of units
Year ended March 31, 2010 vs. 2009 Change
2009 2010 Amount Percentage
Toyota’s consolidated vehicle unit sales 1,443 1,139 (304) −21.1%
Yen in millions
Year ended March 31, 2010 vs. 2009 Change
2009 2010 Amount Percentage
Net revenues:
Sales of products ¥1,779,089 ¥1,571,846 ¥(207,243) −11.6%
Financial services 103,811 102,015 (1,796) −1.7%
Total ¥1,882,900 ¥1,673,861 ¥(209,039) −11.1%
Other
Thousands of units
Year ended March 31, 2010 vs. 2009 Change
2009 2010 Amount Percentage
Toyota’s consolidated vehicle unit sales 905 979 74 +8.3%
Yen in millions
Year ended March 31, 2010 vs. 2009 Change
2009 2010 Amount Percentage
Net revenues:
Sales of products ¥2,676,939 ¥2,612,595 ¥(64,344) −2.4%
Financial services 42,390 42,732 342 +0.8%
Total ¥2,719,329 ¥2,655,327 ¥(64,002) −2.4%
Asia
Although retail sales of Toyota and Lexus
brands’ vehicle increased in some European
countries such as increases of 9 thousand
vehicles, or 8.5%, in Germany and 7 thousand
vehicles, or 14.5%, in Spain compared with the
prior fiscal year benefiting from various
government stimulus packages, net revenues
Although Toyota’s vehicle unit sales increased by
74 thousand vehicles, particularly in Thailand and
Indonesia, compared with the prior fiscal year
due primarily to various government stimulus
packages, net revenues in Asia decreased due
primarily to the unfavorable impact of fluctuations
in Europe overall decreased primarily due to
the 204 thousand vehicles decrease in Toyota’s
vehicle unit sales which resulted from the
downturn in the market and the impact of
fluctuations in foreign currency translation rates
of ¥260.6 billion.
in foreign currency translation rates of ¥212.9
billion. Excluding the difference in the Japanese
yen value used for translation purposes of ¥212.9
billion, net revenues would have increased by
¥148.6 billion.
Thousands of units
Year ended March 31, 2010 vs. 2009 Change
2009 2010 Amount Percentage
Toyota’s consolidated vehicle unit sales 2,212 2,098 (114) −5.2%
Yen in millions
Year ended March 31, 2010 vs. 2009 Change
2009 2010 Amount Percentage
Net revenues:
Sales of products ¥5,226,426 ¥4,782,379 ¥(444,047) −8.5%
Financial services 996,488 888,147 (108,341) −10.9%
Total ¥6,222,914 ¥5,670,526 ¥(552,388) −8.9%
North America
In North America, the market is recovering
gradually from the downturn stemming from the
financial crisis since the fall of 2008 and Toyota’s
vehicle unit sales in the second half of fiscal 2010
increased by 339 thousand vehicles, or 39.6%,
year-on-year primarily consisting of an increase
by 57 thousand vehicles, or 35.3%, increase in
Corolla sales, 50 thousand vehicles, or 33.9%, in
Camry sales, 48 thousand vehicles, or 86.1%, in
RAV4 sales, and 11 thousand vehicles, or 30.2%,
in sales of the new Sienna. This increase was in
spite of having influence by recalls and other
safety measures, such as the temporary decrease
in retail sales of Toyota brand’s vehicle by 18
thousand vehicles, or 15.8%, in January, 2010
and 9 thousand vehicles, or 8.5%, decrease in
February, 2010 in each case compared with the
same month in the prior year. However, net
revenues decreased primarily as a result of a
decrease in vehicle unit sales by 114 thousand
vehicles during fiscal 2010 compared with the
prior fiscal year due to a significant decrease in
vehicle unit sales by 453 thousand vehicles, or
33.4%, caused by the downturn in the market
during the first half of fiscal 2010 and the impact
of fluctuation in foreign currency translation rates
of ¥474.6 billion.
57
TOYOTA ANNUAL REPORT 2011