Coca Cola 2011 Annual Report Download - page 101
Download and view the complete annual report
Please find page 101 of the 2011 Coca Cola annual report below. You can navigate through the pages in the report by either clicking on the pages listed below, or by using the keyword search tool below to find specific information within the annual report.-
 1
1 -
2
-
3
-
4
-
5
-
6
-
7
-
8
-
9
-
10
-
11
-
12
-
13
-
14
-
15
-
16
-
17
-
18
-
19
-
20
-
21
-
22
-
23
-
24
-
25
-
26
-
27
-
28
-
29
-
30
-
31
-
32
-
33
-
34
-
35
-
36
-
37
-
38
-
39
-
40
-
41
-
42
-
43
-
44
-
45
-
46
-
47
-
48
-
49
-
50
-
51
-
52
-
53
-
54
-
55
-
56
-
57
-
58
-
59
-
60
-
61
-
62
-
63
-
64
-
65
-
66
-
67
-
68
-
69
-
70
-
71
-
72
-
73
-
74
-
75
-
76
-
77
-
78
-
79
-
80
-
81
-
82
-
83
-
84
-
85
-
86
-
87
-
88
-
89
-
90
-
 91
91 -
 92
92 -
 93
93 -
 94
94 -
 95
95 -
 96
96 -
 97
97 -
 98
98 -
 99
99 -
 100
100 -
 101
101 -
 102
102 -
 103
103 -
 104
104 -
 105
105 -
 106
106 -
 107
107 -
 108
108 -
 109
109 -
 110
110 -
 111
111 -
112
-
113
-
114
-
115
-
116
-
117
-
118
-
119
-
120
-
121
-
122
-
123
-
124
-
125
-
126
-
127
-
128
-
129
-
130
-
131
-
132
-
133
-
134
-
135
-
136
-
137
-
138
-
139
-
140
-
141
-
142
-
143
-
144
-
145
-
146
-
147
-
148
-
149
-
150
-
151
-
152
-
153
-
154
-
155
-
156
-
157
-
158
-
159
-
160
-
161
-
162
-
163
-
164
-
165
-
166
 |
 |

thereafter, whether the financial instruments used in hedging transactions are effective at offsetting changes in either the fair
values or cash flows of the related underlying exposures. Any ineffective portion of a financial instrument’s change in fair value is
immediately recognized into earnings.
The Company determines the fair values of its derivatives based on quoted market prices or using standard valuation models.
Refer to Note 16. The notional amounts of the derivative financial instruments do not necessarily represent amounts exchanged by
the parties and, therefore, are not a direct measure of our exposure to the financial risks described above. The amounts
exchanged are calculated by reference to the notional amounts and by other terms of the derivatives, such as interest rates,
foreign currency exchange rates, commodity rates or other financial indices. The Company does not view the fair values of its
derivatives in isolation, but rather in relation to the fair values or cash flows of the underlying hedged transactions or other
exposures. Virtually all of our derivatives are straightforward over-the-counter instruments with liquid markets.
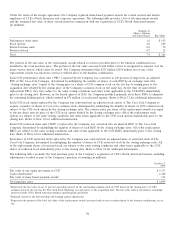
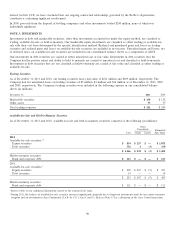
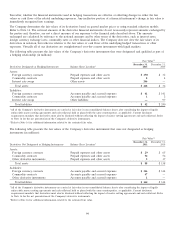
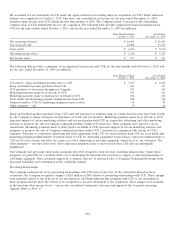
The following table presents the fair values of the Company’s derivative instruments that were designated and qualified as part of
a hedging relationship (in millions):
Fair Value1,2
December 31, December 31,
Derivatives Designated as Hedging Instruments Balance Sheet Location12011 2010
Assets:
Foreign currency contracts Prepaid expenses and other assets $ 170 $32
Commodity contracts Prepaid expenses and other assets 24
Interest rate swaps Other assets 246 —
Total assets $ 418 $36
Liabilities:
Foreign currency contracts Accounts payable and accrued expenses $41 $ 141
Commodity contracts Accounts payable and accrued expenses 12
Interest rate swaps Other liabilities —97
Total liabilities $42 $ 240
1All of the Company’s derivative instruments are carried at fair value in our consolidated balance sheets after considering the impact of legally
enforceable master netting agreements and cash collateral held or placed with the same counterparties, as applicable. Current disclosure
requirements mandate that derivatives must also be disclosed without reflecting the impact of master netting agreements and cash collateral. Refer
to Note 16 for the net presentation of the Company’s derivative instruments.
2Refer to Note 16 for additional information related to the estimated fair value.
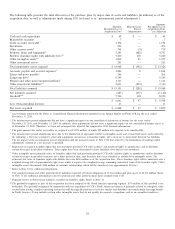
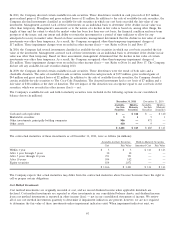
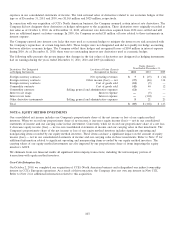
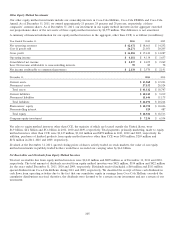
The following table presents the fair values of the Company’s derivative instruments that were not designated as hedging
instruments (in millions):
Fair Value1,2
December 31, December 31,
Derivatives Not Designated as Hedging Instruments Balance Sheet Location12011 2010
Assets:
Foreign currency contracts Prepaid expenses and other assets $29 $65
Commodity contracts Prepaid expenses and other assets 54 56
Other derivative instruments Prepaid expenses and other assets 517
Total assets $88 $ 138
Liabilities:
Foreign currency contracts Accounts payable and accrued expenses $ 116 $ 144
Commodity contracts Accounts payable and accrued expenses 47 —
Other derivative instruments Accounts payable and accrued expenses 1—
Total liabilities $ 164 $ 144
1All of the Company’s derivative instruments are carried at fair value in our consolidated balance sheets after considering the impact of legally
enforceable master netting agreements and cash collateral held or placed with the same counterparties, as applicable. Current disclosure
requirements mandate that derivatives must also be disclosed without reflecting the impact of master netting agreements and cash collateral. Refer
to Note 16 for the net presentation of the Company’s derivative instruments.
2Refer to Note 16 for additional information related to the estimated fair value.
99