Coca Cola 2011 Annual Report Download - page 132
Download and view the complete annual report
Please find page 132 of the 2011 Coca Cola annual report below. You can navigate through the pages in the report by either clicking on the pages listed below, or by using the keyword search tool below to find specific information within the annual report.-
 1
1 -
2
-
3
-
4
-
5
-
6
-
7
-
8
-
9
-
10
-
11
-
12
-
13
-
14
-
15
-
16
-
17
-
18
-
19
-
20
-
21
-
22
-
23
-
24
-
25
-
26
-
27
-
28
-
29
-
30
-
31
-
32
-
33
-
34
-
35
-
36
-
37
-
38
-
39
-
40
-
41
-
42
-
43
-
44
-
45
-
46
-
47
-
48
-
49
-
50
-
51
-
52
-
53
-
54
-
55
-
56
-
57
-
58
-
59
-
60
-
61
-
62
-
63
-
64
-
65
-
66
-
67
-
68
-
69
-
70
-
71
-
72
-
73
-
74
-
75
-
76
-
77
-
78
-
79
-
80
-
81
-
82
-
83
-
84
-
85
-
86
-
87
-
88
-
89
-
90
-
91
-
92
-
93
-
94
-
95
-
96
-
97
-
98
-
99
-
100
-
101
-
102
-
103
-
104
-
105
-
106
-
107
-
108
-
109
-
110
-
111
-
112
-
113
-
114
-
115
-
116
-
117
-
118
-
119
-
120
-
121
-
 122
122 -
 123
123 -
 124
124 -
 125
125 -
 126
126 -
 127
127 -
 128
128 -
 129
129 -
 130
130 -
 131
131 -
 132
132 -
 133
133 -
 134
134 -
 135
135 -
 136
136 -
 137
137 -
 138
138 -
 139
139 -
 140
140 -
 141
141 -
 142
142 -
143
-
144
-
145
-
146
-
147
-
148
-
149
-
150
-
151
-
152
-
153
-
154
-
155
-
156
-
157
-
158
-
159
-
160
-
161
-
162
-
163
-
164
-
165
-
166
 |
 |

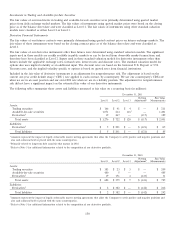
Investments in Trading and Available-for-Sale Securities
The fair values of our investments in trading and available-for-sale securities were primarily determined using quoted market
prices from daily exchange traded markets. The fair values of instruments using quoted market prices were based on the closing
price as of the balance sheet date and were classified as Level 1. The fair values of instruments using other standard valuation
models were classified as either Level 2 or Level 3.
Derivative Financial Instruments
The fair values of our futures contracts were primarily determined using quoted contract prices on futures exchange markets. The
fair values of these instruments were based on the closing contract price as of the balance sheet date and were classified as
Level 1.
The fair values of our derivative instruments other than futures were determined using standard valuation models. The significant
inputs used in these models are readily available in public markets or can be derived from observable market transactions, and
therefore have been classified as Level 2. Inputs used in these standard valuation models for derivative instruments other than
futures include the applicable exchange rates, forward rates, interest rates and discount rates. The standard valuation model for
options also uses implied volatility as an additional input. The discount rates are based on the historical U.S. Deposit or U.S.
Treasury rates, and the implied volatility specific to options is based on quoted rates from financial institutions.
Included in the fair value of derivative instruments is an adjustment for nonperformance risk. The adjustment is based on the
current one-year credit default swap (‘‘CDS’’) rate applied to each contract, by counterparty. We use our counterparty’s CDS rate
when we are in an asset position and our own CDS rate when we are in a liability position. The adjustment for nonperformance
risk did not have a significant impact on the estimated fair value of our derivative instruments.
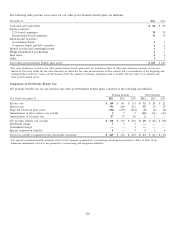
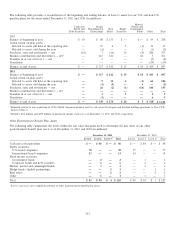
The following tables summarize those assets and liabilities measured at fair value on a recurring basis (in millions):
December 31, 2011
Netting Fair Value
Level 1 Level 2 Level 3 Adjustment1Measurements
Assets:
Trading securities $ 166 $ 41 $ 4 $ — $ 211
Available-for-sale securities 1,071 214 1162— 1,401
Derivatives339 467 — (117) 389
Total assets $ 1,276 $ 722 $ 120 $ (117) $ 2,001
Liabilities:
Derivatives3$ 5 $ 201 $ — $ (121) $ 85
Total liabilities $ 5 $ 201 $ — $ (121) $ 85
1Amounts represent the impact of legally enforceable master netting agreements that allow the Company to settle positive and negative positions and
also cash collateral held or placed with the same counterparties.
2Primarily related to long-term debt securities that mature in 2018.
3Refer to Note 5 for additional information related to the composition of our derivative portfolio.
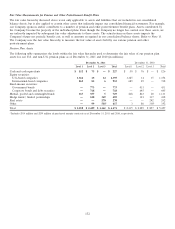
December 31, 2010
Netting Fair Value
Level 1 Level 2 Level 3 Adjustment1Measurements
Assets:
Trading securities $ 183 $ 23 $ 3 $ — $ 209
Available-for-sale securities 480 5 — — 485
Derivatives219 151 4 (143) 31
Total assets $ 682 $ 179 $ 7 $ (143) $ 725
Liabilities:
Derivatives2$ 2 $ 382 $ — $ (142) $ 242
Total liabilities $ 2 $ 382 $ — $ (142) $ 242
1Amounts represent the impact of legally enforceable master netting agreements that allow the Company to settle positive and negative positions and
also cash collateral held or placed with the same counterparties.
2Refer to Note 5 for additional information related to the composition of our derivative portfolio.
130