Coca Cola 2011 Annual Report Download - page 134
Download and view the complete annual report
Please find page 134 of the 2011 Coca Cola annual report below. You can navigate through the pages in the report by either clicking on the pages listed below, or by using the keyword search tool below to find specific information within the annual report.-
 1
1 -
2
-
3
-
4
-
5
-
6
-
7
-
8
-
9
-
10
-
11
-
12
-
13
-
14
-
15
-
16
-
17
-
18
-
19
-
20
-
21
-
22
-
23
-
24
-
25
-
26
-
27
-
28
-
29
-
30
-
31
-
32
-
33
-
34
-
35
-
36
-
37
-
38
-
39
-
40
-
41
-
42
-
43
-
44
-
45
-
46
-
47
-
48
-
49
-
50
-
51
-
52
-
53
-
54
-
55
-
56
-
57
-
58
-
59
-
60
-
61
-
62
-
63
-
64
-
65
-
66
-
67
-
68
-
69
-
70
-
71
-
72
-
73
-
74
-
75
-
76
-
77
-
78
-
79
-
80
-
81
-
82
-
83
-
84
-
85
-
86
-
87
-
88
-
89
-
90
-
91
-
92
-
93
-
94
-
95
-
96
-
97
-
98
-
99
-
100
-
101
-
102
-
103
-
104
-
105
-
106
-
107
-
108
-
109
-
110
-
111
-
112
-
113
-
114
-
115
-
116
-
117
-
118
-
119
-
120
-
121
-
122
-
123
-
 124
124 -
 125
125 -
 126
126 -
 127
127 -
 128
128 -
 129
129 -
 130
130 -
 131
131 -
 132
132 -
 133
133 -
 134
134 -
 135
135 -
 136
136 -
 137
137 -
 138
138 -
 139
139 -
 140
140 -
 141
141 -
 142
142 -
 143
143 -
 144
144 -
145
-
146
-
147
-
148
-
149
-
150
-
151
-
152
-
153
-
154
-
155
-
156
-
157
-
158
-
159
-
160
-
161
-
162
-
163
-
164
-
165
-
166
 |
 |

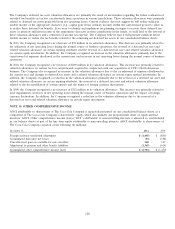
Fair Value Measurements for Pension and Other Postretirement Benefit Plans
The fair value hierarchy discussed above is not only applicable to assets and liabilities that are included in our consolidated
balance sheets, but is also applied to certain other assets that indirectly impact our consolidated financial statements. For example,
our Company sponsors and/or contributes to a number of pension and other postretirement benefit plans. Assets contributed by
the Company become the property of the individual plans. Even though the Company no longer has control over these assets, we
are indirectly impacted by subsequent fair value adjustments to these assets. The actual return on these assets impacts the
Company’s future net periodic benefit cost, as well as amounts recognized in our consolidated balance sheets. Refer to Note 13.
The Company uses the fair value hierarchy to measure the fair value of assets held by our various pension and other
postretirement plans.
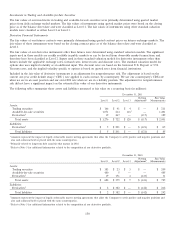
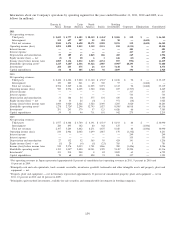
Pension Plan Assets
The following table summarizes the levels within the fair value hierarchy used to determine the fair value of our pension plan
assets for our U.S. and non-U.S. pension plans as of December 31, 2011 and 2010 (in millions):
December 31, 2011 December 31, 2010
Level 1 Level 2 Level 3 Total Level 1 Level 2 Level 3 Total
Cash and cash equivalents $ 152 $ 75 $ — $ 227 $ 50 $ 76 $ — $ 126
Equity securities:
U.S.-based companies 1,366 15 14 1,395 1,325 14 15 1,354
International-based companies 865 82 6 953 689 49 — 738
Fixed-income securities:
Government bonds — 773 — 773 — 431 — 431
Corporate bonds and debt securities — 718 — 718 — 645 — 645
Mutual, pooled and commingled funds 167 557 5 729 248 863 20 1,131
Hedge funds / limited partnerships — 140 349 489 — 121 317 438
Real estate — — 270 270 — — 242 242
Other — 99 5181617 3 86 3031392
Total $ 2,550 $ 2,459 $ 1,162 $ 6,171 $ 2,315 $ 2,285 $ 897 $ 5,497
1Includes $514 million and $299 million of purchased annuity contracts as of December 31, 2011 and 2010, respectively.
132