Coca Cola 2011 Annual Report Download - page 129
Download and view the complete annual report
Please find page 129 of the 2011 Coca Cola annual report below. You can navigate through the pages in the report by either clicking on the pages listed below, or by using the keyword search tool below to find specific information within the annual report.-
 1
1 -
2
-
3
-
4
-
5
-
6
-
7
-
8
-
9
-
10
-
11
-
12
-
13
-
14
-
15
-
16
-
17
-
18
-
19
-
20
-
21
-
22
-
23
-
24
-
25
-
26
-
27
-
28
-
29
-
30
-
31
-
32
-
33
-
34
-
35
-
36
-
37
-
38
-
39
-
40
-
41
-
42
-
43
-
44
-
45
-
46
-
47
-
48
-
49
-
50
-
51
-
52
-
53
-
54
-
55
-
56
-
57
-
58
-
59
-
60
-
61
-
62
-
63
-
64
-
65
-
66
-
67
-
68
-
69
-
70
-
71
-
72
-
73
-
74
-
75
-
76
-
77
-
78
-
79
-
80
-
81
-
82
-
83
-
84
-
85
-
86
-
87
-
88
-
89
-
90
-
91
-
92
-
93
-
94
-
95
-
96
-
97
-
98
-
99
-
100
-
101
-
102
-
103
-
104
-
105
-
106
-
107
-
108
-
109
-
110
-
111
-
112
-
113
-
114
-
115
-
116
-
117
-
118
-
 119
119 -
 120
120 -
 121
121 -
 122
122 -
 123
123 -
 124
124 -
 125
125 -
 126
126 -
 127
127 -
 128
128 -
 129
129 -
 130
130 -
 131
131 -
 132
132 -
 133
133 -
 134
134 -
 135
135 -
 136
136 -
 137
137 -
 138
138 -
 139
139 -
140
-
141
-
142
-
143
-
144
-
145
-
146
-
147
-
148
-
149
-
150
-
151
-
152
-
153
-
154
-
155
-
156
-
157
-
158
-
159
-
160
-
161
-
162
-
163
-
164
-
165
-
166
 |
 |

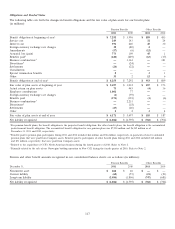
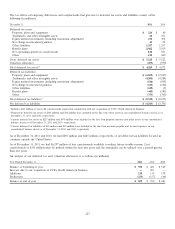
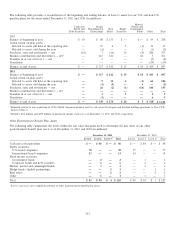
The tax effects of temporary differences and carryforwards that give rise to deferred tax assets and liabilities consist of the
following (in millions):
December 31, 2011 2010
Deferred tax assets:
Property, plant and equipment $ 224 $49
Trademarks and other intangible assets 68 271
Equity method investments (including translation adjustment) 278 304
Net change in unrealized gain/loss 43 28
Other liabilities 1,257 1,257
Benefit plans 2,022 2,019
Net operating/capital loss carryforwards 818 911
Other 418 6831
Gross deferred tax assets $ 5,128 $ 5,522
Valuation allowances (859) (950)
Total deferred tax assets2,3 $ 4,269 $ 4,572
Deferred tax liabilities:
Property, plant and equipment $ (2,039) $ (2,227)
Trademarks and other intangible assets (4,201) (4,284)
Equity method investments (including translation adjustment) (816) (509)
Net change in unrealized gain/loss (129) (102)
Other liabilities (129) (5)
Benefit plans (445) (383)
Other (753) (765)
Total deferred tax liabilities4$ (8,512) $ (8,275)
Net deferred tax liabilities $ (4,243) $ (3,703)
1Includes $183 million of tax credit carryforwards acquired in conjunction with our acquisition of CCE’s North American business.
2Noncurrent deferred tax assets of $243 million and $98 million were included in the line item other assets in our consolidated balance sheets as of
December 31, 2011 and 2010, respectively.
3Current deferred tax assets of $227 million and $478 million were included in the line item prepaid expenses and other assets in our consolidated
balance sheets as of December 31, 2011 and 2010, respectively.
4Current deferred tax liabilities of $19 million and $18 million were included in the line item accounts payable and accrued expenses in our
consolidated balance sheets as of December 31, 2011 and 2010, respectively.
As of December 31, 2011 and 2010, we had $491 million and $445 million, respectively, of net deferred tax liabilities located in
countries outside the United States.
As of December 31, 2011, we had $6,297 million of loss carryforwards available to reduce future taxable income. Loss
carryforwards of $391 million must be utilized within the next five years and the remainder can be utilized over a period greater
than five years.
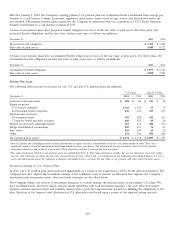
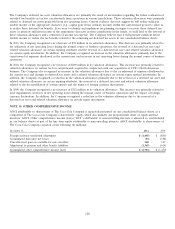
An analysis of our deferred tax asset valuation allowances is as follows (in millions):
Year Ended December 31, 2011 2010 2009
Balance at beginning of year $ 950 $ 681 $ 569
Increase due to our acquisition of CCE’s North American business —291 —
Additions 138 115 178
Deductions (229) (137) (66)
Balance at end of year $ 859 $ 950 $ 681
127