Coca Cola 2011 Annual Report Download - page 59
Download and view the complete annual report
Please find page 59 of the 2011 Coca Cola annual report below. You can navigate through the pages in the report by either clicking on the pages listed below, or by using the keyword search tool below to find specific information within the annual report.-
 1
1 -
2
-
3
-
4
-
5
-
6
-
7
-
8
-
9
-
10
-
11
-
12
-
13
-
14
-
15
-
16
-
17
-
18
-
19
-
20
-
21
-
22
-
23
-
24
-
25
-
26
-
27
-
28
-
29
-
30
-
31
-
32
-
33
-
34
-
35
-
36
-
37
-
38
-
39
-
40
-
41
-
42
-
43
-
44
-
45
-
46
-
47
-
48
-
 49
49 -
 50
50 -
 51
51 -
 52
52 -
 53
53 -
 54
54 -
 55
55 -
 56
56 -
 57
57 -
 58
58 -
 59
59 -
 60
60 -
 61
61 -
 62
62 -
 63
63 -
 64
64 -
 65
65 -
 66
66 -
 67
67 -
 68
68 -
 69
69 -
70
-
71
-
72
-
73
-
74
-
75
-
76
-
77
-
78
-
79
-
80
-
81
-
82
-
83
-
84
-
85
-
86
-
87
-
88
-
89
-
90
-
91
-
92
-
93
-
94
-
95
-
96
-
97
-
98
-
99
-
100
-
101
-
102
-
103
-
104
-
105
-
106
-
107
-
108
-
109
-
110
-
111
-
112
-
113
-
114
-
115
-
116
-
117
-
118
-
119
-
120
-
121
-
122
-
123
-
124
-
125
-
126
-
127
-
128
-
129
-
130
-
131
-
132
-
133
-
134
-
135
-
136
-
137
-
138
-
139
-
140
-
141
-
142
-
143
-
144
-
145
-
146
-
147
-
148
-
149
-
150
-
151
-
152
-
153
-
154
-
155
-
156
-
157
-
158
-
159
-
160
-
161
-
162
-
163
-
164
-
165
-
166
 |
 |

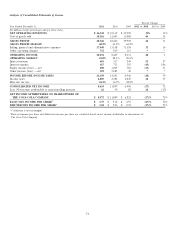
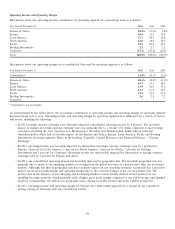
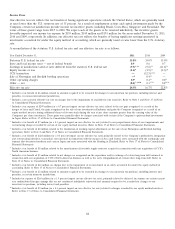
Other Operating Charges
Other operating charges incurred by operating segment were as follows (in millions):
Year Ended December 31, 2011 2010 2009
Eurasia & Africa $12 $7$4
Europe 25 50 7
Latin America 4——
North America 374 133 31
Pacific 54 22 1
Bottling Investments 89 122 141
Corporate 174 485 129
Total $ 732 $ 819 $ 313
In 2011, the Company incurred other operating charges of $732 million, which primarily consisted of $633 million associated with
the Company’s productivity, integration and restructuring initiatives; $50 million due to charges associated with the earthquake
and tsunami that devastated northern and eastern Japan on March 11, 2011; $35 million of costs associated with the merger of
Embotelladoras Arca, S.A.B. de C.V. (‘‘Arca’’) and Grupo Continental S.A.B. (‘‘Contal’’); and $10 million associated with the
floods in Thailand that impacted the Company’s supply chain operations in the region. The Company’s integration activities
include costs associated with the integration of CCE’s North American business, as well as the integration of 18 German bottling
and distribution operations acquired in 2007.
In 2010, the Company began an integration initiative related to our acquisition of CCE’s North American business on October 2,
2010. Upon completion of the CCE transaction, we combined the management of the acquired North American business with the
management of our existing foodservice business; Minute Maid and Odwalla juice businesses; North America supply chain
operations; and Company-owned bottling operations in Philadelphia, Pennsylvania, into a unified bottling and customer service
organization called CCR. In addition, we reshaped our remaining CCNA operations into an organization that primarily provides
franchise leadership and consumer marketing and innovation for the North American market. As a result of the transaction and
related reorganization, our North American businesses operate as aligned and agile organizations with distinct capabilities,
responsibilities and strengths. Refer to Note 2 of Notes to Consolidated Financial Statements.
We incurred expenses of $358 million in 2011 related to this initiative which impacted the North America and Corporate
operating segments. These expenses were primarily related to both internal and external costs associated with the development,
design and initial implementation of our future operating framework as well as contract termination fees and relocation costs. We
believe this acquisition will result in an evolved franchise system that will enable us to better serve the unique needs of the North
American market. The creation of a unified operating system will strategically position us to better market and distribute our
nonalcoholic beverage brands in North America. The Company initially estimated that the total cost of these integration initiatives
would be approximately $425 million, and the initiatives were expected to generate annualized savings of at least $350 million per
year. The Company realized nearly all of the $350 million in annualized savings by the end of 2011, and the total cost we incurred
since the inception of this integration initiative was $493 million. As such, this initiative was successfully completed at the end of
2011. Refer to Note 18 of Notes to Consolidated Financial Statements for additional information related to this integration
initiative.
The Company’s integration initiatives include costs related to the integration of 18 German bottling and distribution operations
acquired in 2007. We incurred expenses of $67 million in 2011 related to this initiative. The expenses recorded in connection with
these integration activities have been primarily due to involuntary terminations. The Company began these integration initiatives
in 2008 and has incurred total pretax expenses of $292 million since they commenced. The Company is currently reviewing other
integration and restructuring opportunities within the German bottling and distribution operations, which if implemented will
result in additional charges in future periods. However, as of December 31, 2011, the Company had not finalized any additional
plans. Refer to Note 18 of Notes to Consolidated Financial Statements for additional information related to this integration
initiative.
During 2011, the Company successfully completed our four-year global productivity program and exceeded our target of
providing $500 million in annualized savings from these initiatives by the end of 2011. These savings have provided the
Company additional flexibility to invest for growth. The Company generated these savings in a number of areas, which include
aggressively managing operating expenses supported by lean techniques, redesigning key processes to drive standardization and
effectiveness, better leveraging our size and scale, and driving savings in indirect costs through the implementation of a
‘‘procure-to-pay’’ program. In realizing these savings, the Company incurred total costs of $508 million related to these
57