Coca Cola 2011 Annual Report Download - page 141
Download and view the complete annual report
Please find page 141 of the 2011 Coca Cola annual report below. You can navigate through the pages in the report by either clicking on the pages listed below, or by using the keyword search tool below to find specific information within the annual report.-
 1
1 -
2
-
3
-
4
-
5
-
6
-
7
-
8
-
9
-
10
-
11
-
12
-
13
-
14
-
15
-
16
-
17
-
18
-
19
-
20
-
21
-
22
-
23
-
24
-
25
-
26
-
27
-
28
-
29
-
30
-
31
-
32
-
33
-
34
-
35
-
36
-
37
-
38
-
39
-
40
-
41
-
42
-
43
-
44
-
45
-
46
-
47
-
48
-
49
-
50
-
51
-
52
-
53
-
54
-
55
-
56
-
57
-
58
-
59
-
60
-
61
-
62
-
63
-
64
-
65
-
66
-
67
-
68
-
69
-
70
-
71
-
72
-
73
-
74
-
75
-
76
-
77
-
78
-
79
-
80
-
81
-
82
-
83
-
84
-
85
-
86
-
87
-
88
-
89
-
90
-
91
-
92
-
93
-
94
-
95
-
96
-
97
-
98
-
99
-
100
-
101
-
102
-
103
-
104
-
105
-
106
-
107
-
108
-
109
-
110
-
111
-
112
-
113
-
114
-
115
-
116
-
117
-
118
-
119
-
120
-
121
-
122
-
123
-
124
-
125
-
126
-
127
-
128
-
129
-
130
-
 131
131 -
 132
132 -
 133
133 -
 134
134 -
 135
135 -
 136
136 -
 137
137 -
 138
138 -
 139
139 -
 140
140 -
 141
141 -
 142
142 -
 143
143 -
 144
144 -
 145
145 -
 146
146 -
 147
147 -
 148
148 -
 149
149 -
 150
150 -
 151
151 -
152
-
153
-
154
-
155
-
156
-
157
-
158
-
159
-
160
-
161
-
162
-
163
-
164
-
165
-
166
 |
 |

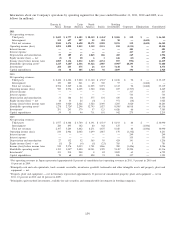
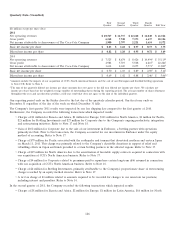
Information about our Company’s operations by operating segment for the years ended December 31, 2011, 2010 and 2009, is as
follows (in millions):
Eurasia & Latin North Bottling
Africa Europe America America Pacific Investments Corporate Eliminations Consolidated
2011
Net operating revenues:
Third party $ 2,689 $ 4,777 $ 4,403 $ 20,559 $ 5,4541$ 8,501 $ 159 $ — $ 46,542
Intersegment 152 697 287 12 384 90 — (1,622) —
Total net revenues 2,841 5,474 4,690 20,571 5,838 8,591 159 (1,622) 46,542
Operating income (loss) 1,091 3,090 2,815 2,318 2,151 224 (1,535) — 10,154
Interest income — — — — — — 483 — 483
Interest expense — — — — — — 417 — 417
Depreciation and amortization 39 109 63 1,065 106 403 169 — 1,954
Equity income (loss) — net (3) 33 20 6 1 646 (13) — 690
Income (loss) before income taxes 1,089 3,134 2,832 2,325 2,154 897 (992) — 11,439
Identifiable operating assets21,245 3,20432,446 33,422 2,085 8,905320,293 — 71,600
Investments4284 243 475 26 133 7,140 73 — 8,374
Capital expenditures 86 38 105 1,364 92 1,039 196 — 2,920
2010
Net operating revenues:
Third party $ 2,426 $ 4,424 $ 3,880 $ 11,140 $ 4,9411$ 8,216 $ 92 $ — $ 35,119
Intersegment 130 825 241 65 330 97 — (1,688) —
Total net revenues 2,556 5,249 4,121 11,205 5,271 8,313 92 (1,688) 35,119
Operating income (loss) 980 2,976 2,405 1,520 2,048 227 (1,707) — 8,449
Interest income — — — — — — 317 — 317
Interest expense — — — — — — 733 — 733
Depreciation and amortization 31 106 54 575 101 430 146 — 1,443
Equity income (loss) — net 18 33 24 (4) 1 971 (18) — 1,025
Income (loss) before income taxes 1,000 3,020 2,426 1,523 2,049 1,205 3,020 — 14,243
Identifiable operating assets21,278 2,72432,298 32,793 1,827 8,398316,018 — 65,336
Investments4291 243 379 57 123 6,426 66 — 7,585
Capital expenditures 59 33 94 711 101 942 275 — 2,215
2009
Net operating revenues:
Third party $ 1,977 $ 4,308 $ 3,700 $ 8,191 $ 4,5331$ 8,193 $ 88 $ — $ 30,990
Intersegment 220 895 182 80 342 127 — (1,846) —
Total net revenues 2,197 5,203 3,882 8,271 4,875 8,320 88 (1,846) 30,990
Operating income (loss) 810 2,946 2,042 1,699 1,887 179 (1,332) — 8,231
Interest income — — — — — — 249 — 249
Interest expense — — — — — — 355 — 355
Depreciation and amortization 27 132 52 365 95 424 141 — 1,236
Equity income (loss) — net (1) 20 (4) (1) (23) 785 5 — 781
Income (loss) before income taxes 810 2,976 2,039 1,701 1,866 980 (1,426) — 8,946
Identifiable operating assets21,155 3,04732,480 10,941 1,929 9,140313,224 — 41,916
Investments4331 214 248 8 82 5,809 63 — 6,755
Capital expenditures 70 68 123 458 91 826 357 — 1,993
1Net operating revenues in Japan represented approximately 8 percent of consolidated net operating revenues in 2011, 9 percent in 2010 and
10 percent in 2009.
2Principally cash and cash equivalents, trade accounts receivable, inventories, goodwill, trademarks and other intangible assets and property, plant and
equipment — net.
3Property, plant and equipment — net in Germany represented approximately 10 percent of consolidated property, plant and equipment — net in
2011, 10 percent in 2010 and 18 percent in 2009.
4Principally equity method investments, available-for-sale securities and nonmarketable investments in bottling companies.
139