Coca Cola 2011 Annual Report Download - page 51
Download and view the complete annual report
Please find page 51 of the 2011 Coca Cola annual report below. You can navigate through the pages in the report by either clicking on the pages listed below, or by using the keyword search tool below to find specific information within the annual report.-
 1
1 -
2
-
3
-
4
-
5
-
6
-
7
-
8
-
9
-
10
-
11
-
12
-
13
-
14
-
15
-
16
-
17
-
18
-
19
-
20
-
21
-
22
-
23
-
24
-
25
-
26
-
27
-
28
-
29
-
30
-
31
-
32
-
33
-
34
-
35
-
36
-
37
-
38
-
39
-
40
-
 41
41 -
 42
42 -
 43
43 -
 44
44 -
 45
45 -
 46
46 -
 47
47 -
 48
48 -
 49
49 -
 50
50 -
 51
51 -
 52
52 -
 53
53 -
 54
54 -
 55
55 -
 56
56 -
 57
57 -
 58
58 -
 59
59 -
 60
60 -
 61
61 -
62
-
63
-
64
-
65
-
66
-
67
-
68
-
69
-
70
-
71
-
72
-
73
-
74
-
75
-
76
-
77
-
78
-
79
-
80
-
81
-
82
-
83
-
84
-
85
-
86
-
87
-
88
-
89
-
90
-
91
-
92
-
93
-
94
-
95
-
96
-
97
-
98
-
99
-
100
-
101
-
102
-
103
-
104
-
105
-
106
-
107
-
108
-
109
-
110
-
111
-
112
-
113
-
114
-
115
-
116
-
117
-
118
-
119
-
120
-
121
-
122
-
123
-
124
-
125
-
126
-
127
-
128
-
129
-
130
-
131
-
132
-
133
-
134
-
135
-
136
-
137
-
138
-
139
-
140
-
141
-
142
-
143
-
144
-
145
-
146
-
147
-
148
-
149
-
150
-
151
-
152
-
153
-
154
-
155
-
156
-
157
-
158
-
159
-
160
-
161
-
162
-
163
-
164
-
165
-
166
 |
 |
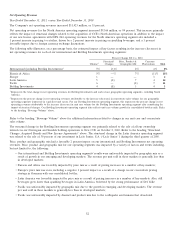
In Pacific, unit case volume increased 5 percent, which consisted of 4 percent growth in sparkling beverages and 8 percent growth
in still beverages. The group’s volume growth was led by 13 percent growth in China, which included 12 percent growth in
sparkling beverages attributable to strong growth in Trademark Sprite, Coca-Cola and Fanta. The group also benefited from
China’s 16 percent growth in still beverages, including strong growth in Minute Maid Pulpy and other still beverages, including
water. In Japan, unit case volume growth was even, reflecting the impact of the earthquake and tsunami that devastated the
northern and eastern portions of the country on March 11, 2011. The group’s unit case volume growth in the markets described
above was partially offset by a 9 percent volume decline in the Philippines.
Unit case volume for Bottling Investments was even when compared to the prior year. The group had growth in key markets
where we own or otherwise consolidate bottling operations, including unit case volume growth of 13 percent in China, 12 percent
in India and 6 percent in Germany. The Company’s consolidated bottling operations accounted for 34 percent, 66 percent and
100 percent of the unit case volume in China, India and Germany, respectively. However, growth in these markets was offset by
the unfavorable impact of the Company’s sale of our Norwegian and Swedish bottling operations to New CCE during the fourth
quarter of 2010 as well as a unit case volume decline of 9 percent in the Philippines where we own 100 percent of the country’s
bottling operations.
Year Ended December 31, 2010, versus Year Ended December 31, 2009
In Eurasia and Africa, unit case volume increased 12 percent, which consisted of 10 percent growth in sparkling beverages and
21 percent growth in still beverages. The group’s unit case volume growth was primarily attributable to 17 percent growth in India,
which included growth of 15 percent and 23 percent in sparkling and still beverages, respectively. India’s growth in sparkling
beverages was led by double-digit growth in Trademarks Sprite, Thums Up and Coca-Cola, which reflected the benefit of
successful national marketing programs. Still beverage growth in India included the impact of 22 percent growth in our Maaza
juice brand. In addition to growth in India, the group’s unit case volume growth included 14 percent growth in Turkey, 8 percent
growth in North and West Africa, 16 percent growth in Russia, 20 percent growth in Southern Eurasia, 12 percent growth in East
and Central Africa and 5 percent growth in South Africa. The growth across the African continent was attributable to the strong
performance of both sparkling and still beverages and the benefit of our FIFA World CupTM activation programs.
Unit case volume in Europe was even, which reflected the impact of continuing difficult macroeconomic conditions throughout
certain regions in Europe. The group’s unit case volume included unit case volume growth of 5 percent in France, 1 percent in
Germany and 2 percent in our Nordic Business Unit. The growth in these regions was offset by unit case volume declines in other
regions, including a 7 percent decline in South and Eastern Europe, primarily due to continuing macroeconomic pressures. The
group’s unit case volume also included unit case volume declines of 2 percent and 1 percent in Italy and Iberia, respectively.
In Latin America, unit case volume increased 5 percent, which consisted of 4 percent growth in sparkling beverages and 9 percent
growth in still beverages. The group’s unit case volume growth was led by 11 percent growth in Brazil and 3 percent growth in
Mexico. Brazil’s unit case volume growth was primarily due to 11 percent growth in sparkling beverages, led by 11 percent growth
in Trademark Coca-Cola. Mexico’s unit case volume growth was impacted by adverse weather conditions. The group’s unit case
volume growth also included 5 percent growth in our South Latin Business Unit. All of the aforementioned markets benefited
from our strong FIFA World CupTM activation programs.
Unit case volume in North America increased 2 percent, including 1 percent attributable to the new license agreements with DPS.
The group’s unit case volume growth was driven by 5 percent growth in still beverages, led by 19 percent growth in Trademark
Powerade, 12 percent growth in teas and 23 percent growth in Trademark Simply. Unit case volume for sparkling beverages in
North America increased 1 percent, primarily due to the sale of DPS brands under the new license agreements. Coca-Cola Zero
continued its strong performance in North America with 15 percent growth in 2010. The group’s strong marketing initiatives,
including our FIFA World CupTM activation programs, contributed to the unit case volume growth in North America.
The volume and net operating revenues attributable to the sale of DPS brands have been included as a structural change in our
analysis of net operating revenues. Refer to the heading ‘‘Net Operating Revenues’’ below and ‘‘Structural Changes, Acquired
Brands and New License Agreements’’ above.
In Pacific, unit case volume increased 6 percent, which consisted of 13 percent growth in still beverages and 2 percent growth in
sparkling beverages. The group’s volume growth was led by 6 percent growth in China, 15 percent growth in the Philippines and
3 percent growth in Japan. China’s volume growth included 21 percent growth in juices and juice drinks primarily due to the
continued strong momentum of Minute Maid Pulpy, as well as strong growth in other still beverages including water. Tough
weather conditions, including flooding in the higher per capita consumption regions, negatively impacted unit case volume in
China. In the Philippines, unit case volume growth was led by 14 percent growth in Trademark Coca-Cola. In Japan, the unit case
volume growth was driven by successful in-market activations, strong innovation and favorable weather conditions.
49