Coca Cola 2011 Annual Report Download - page 138
Download and view the complete annual report
Please find page 138 of the 2011 Coca Cola annual report below. You can navigate through the pages in the report by either clicking on the pages listed below, or by using the keyword search tool below to find specific information within the annual report.-
 1
1 -
2
-
3
-
4
-
5
-
6
-
7
-
8
-
9
-
10
-
11
-
12
-
13
-
14
-
15
-
16
-
17
-
18
-
19
-
20
-
21
-
22
-
23
-
24
-
25
-
26
-
27
-
28
-
29
-
30
-
31
-
32
-
33
-
34
-
35
-
36
-
37
-
38
-
39
-
40
-
41
-
42
-
43
-
44
-
45
-
46
-
47
-
48
-
49
-
50
-
51
-
52
-
53
-
54
-
55
-
56
-
57
-
58
-
59
-
60
-
61
-
62
-
63
-
64
-
65
-
66
-
67
-
68
-
69
-
70
-
71
-
72
-
73
-
74
-
75
-
76
-
77
-
78
-
79
-
80
-
81
-
82
-
83
-
84
-
85
-
86
-
87
-
88
-
89
-
90
-
91
-
92
-
93
-
94
-
95
-
96
-
97
-
98
-
99
-
100
-
101
-
102
-
103
-
104
-
105
-
106
-
107
-
108
-
109
-
110
-
111
-
112
-
113
-
114
-
115
-
116
-
117
-
118
-
119
-
120
-
121
-
122
-
123
-
124
-
125
-
126
-
127
-
 128
128 -
 129
129 -
 130
130 -
 131
131 -
 132
132 -
 133
133 -
 134
134 -
 135
135 -
 136
136 -
 137
137 -
 138
138 -
 139
139 -
 140
140 -
 141
141 -
 142
142 -
 143
143 -
 144
144 -
 145
145 -
 146
146 -
 147
147 -
 148
148 -
149
-
150
-
151
-
152
-
153
-
154
-
155
-
156
-
157
-
158
-
159
-
160
-
161
-
162
-
163
-
164
-
165
-
166
 |
 |

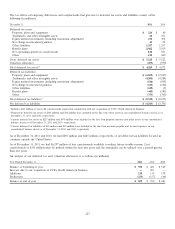
impairments of available-for-sale securities and an equity method investment and a donation of preferred shares in one of our
equity method investees. Refer to Note 16 for fair value disclosures related to these impairments. Refer to Note 19 for the impact
these charges had on our operating segments.
During 2009, the Company realized a gain of $44 million in other income (loss) — net on the sale of equity securities that were
classified as available-for-sale. In 2008, the Company recognized an other-than-temporary impairment on these same securities,
primarily due to the length of time the market value had been less than our cost basis, and the lack of intent to retain the
investment for a period of time sufficient to allow for recovery in market value. The gain on the sale of these securities represents
the appreciation in market value since the impairment was recognized and impacted the Corporate operating segment.
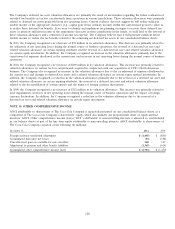
Also during 2009, the Company recorded a charge of $27 million in other income (loss) — net due to an other-than-temporary
decline in the fair value of a cost method investment. As of December 31, 2008, the estimated fair value of this investment
approximated the Company’s carrying value in the investment. However, during the first quarter of 2009, the Company was
informed by the investee of its intent to reorganize its capital structure in 2009, which would result in the Company’s shares in the
investee being canceled. As a result, the Company determined that the decline in fair value of this cost method investment was
other than temporary. This impairment charge impacted the Corporate operating segment. Refer to Note 16 for fair value
disclosures related to this impairment.
NOTE 18: PRODUCTIVITY, INTEGRATION AND RESTRUCTURING INITIATIVES
Productivity Initiatives
During 2008, the Company announced a transformation effort centered on productivity initiatives that will provide additional
flexibility to invest for growth. In 2011, we completed this program. The initiatives impacted a number of areas, including
aggressively managing operating expenses supported by lean techniques; redesigning key processes to drive standardization and
effectiveness; better leveraging our size and scale; and driving savings in indirect costs through the implementation of a
‘‘procure-to-pay’’ program.
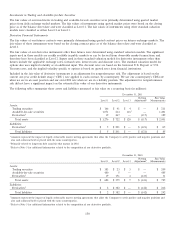
The Company incurred total pretax expenses of $508 million related to these productivity initiatives since they commenced in the
first quarter of 2008. These expenses were recorded in the line item other operating charges. Refer to Note 19 for the impact
these charges had on our operating segments. Other direct costs included both internal and external costs associated with the
development, communication, administration and implementation of these initiatives and accelerated depreciation on certain fixed
assets.
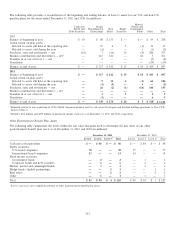
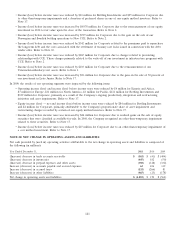
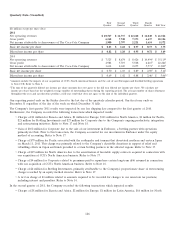
The following table summarizes the balance of accrued expenses related to productivity initiatives and the changes in the accrued
amounts (in millions):
Severance Pay Other
and Benefits Outside Services1Direct Costs Total
2009
Accrued balance as of January 1 $ 14 $ 3 $ — $ 17
Costs incurred 41 47 19 107
Payments (37) (41) (12) (90)
Noncash and exchange — — (3) (3)
Accrued balance as of December 31 $ 18 $ 9 $ 4 $ 31
2010
Costs incurred $ 71 $ 58 $ 61 $ 190
Payments (30) (61) (54) (145)
Noncash and exchange — — (2) (2)
Accrued balance as of December 31 $ 59 $ 6 $ 9 $ 74
2011
Costs incurred $ 59 $ 17 $ 80 $ 156
Payments (50) (21) (71) (142)
Noncash and exchange (20) 1 (9) (28)
Accrued balance as of December 31 $48 $ 3 $ 9 $ 60
1Primarily relate to expenses in connection with legal, outplacement and consulting activities.
136