Coca Cola 2011 Annual Report Download - page 58
Download and view the complete annual report
Please find page 58 of the 2011 Coca Cola annual report below. You can navigate through the pages in the report by either clicking on the pages listed below, or by using the keyword search tool below to find specific information within the annual report.-
 1
1 -
2
-
3
-
4
-
5
-
6
-
7
-
8
-
9
-
10
-
11
-
12
-
13
-
14
-
15
-
16
-
17
-
18
-
19
-
20
-
21
-
22
-
23
-
24
-
25
-
26
-
27
-
28
-
29
-
30
-
31
-
32
-
33
-
34
-
35
-
36
-
37
-
38
-
39
-
40
-
41
-
42
-
43
-
44
-
45
-
46
-
47
-
 48
48 -
 49
49 -
 50
50 -
 51
51 -
 52
52 -
 53
53 -
 54
54 -
 55
55 -
 56
56 -
 57
57 -
 58
58 -
 59
59 -
 60
60 -
 61
61 -
 62
62 -
 63
63 -
 64
64 -
 65
65 -
 66
66 -
 67
67 -
 68
68 -
69
-
70
-
71
-
72
-
73
-
74
-
75
-
76
-
77
-
78
-
79
-
80
-
81
-
82
-
83
-
84
-
85
-
86
-
87
-
88
-
89
-
90
-
91
-
92
-
93
-
94
-
95
-
96
-
97
-
98
-
99
-
100
-
101
-
102
-
103
-
104
-
105
-
106
-
107
-
108
-
109
-
110
-
111
-
112
-
113
-
114
-
115
-
116
-
117
-
118
-
119
-
120
-
121
-
122
-
123
-
124
-
125
-
126
-
127
-
128
-
129
-
130
-
131
-
132
-
133
-
134
-
135
-
136
-
137
-
138
-
139
-
140
-
141
-
142
-
143
-
144
-
145
-
146
-
147
-
148
-
149
-
150
-
151
-
152
-
153
-
154
-
155
-
156
-
157
-
158
-
159
-
160
-
161
-
162
-
163
-
164
-
165
-
166
 |
 |

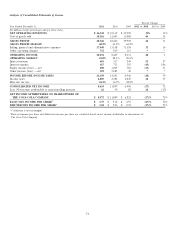
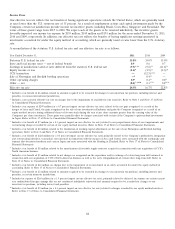
Selling, General and Administrative Expenses
The following table sets forth the significant components of selling, general and administrative expenses (in millions):
Year Ended December 31, 2011 2010 2009
Stock-based compensation expense $ 354 $ 380 $ 241
Advertising expenses 3,256 2,917 2,791
Bottling and distribution expenses 8,501 3,902 2,627
Other operating expenses 5,329 5,959 5,699
Selling, general and administrative expenses $ 17,440 $ 13,158 $ 11,358
Year Ended December 31, 2011, versus Year Ended December 31, 2010
Selling, general and administrative expenses increased $4,282 million, or 33 percent. Foreign currency fluctuations increased
selling, general and administrative expenses by 3 percent. The decrease in stock-based compensation expense was primarily related
to the impact of modifications made to certain replacement performance share unit awards on our prior year results, partially
offset by higher estimated payouts tied to performance in conjunction with our long-term incentive compensation programs.
Advertising expenses increased during the year and reflect the Company’s continued investment in the health and strength of our
brands and building market execution capabilities. The increase in bottling and distribution expenses was primarily due to the full
year impact of consolidating CCE’s North American business in addition to our continued investments in our other bottling
operations around the world. This increase was partially offset by the full year impact of the sale of our Norwegian and Swedish
bottling operations to New CCE during the fourth quarter of 2010. Other operating expenses decreased during the year, partially
reflecting the impact of the Company’s productivity and integration initiatives.
In 2012, our pension expense is expected to decrease by approximately $50 million compared to 2011. The anticipated decrease is
primarily due to approximately $953 million of contributions the Company expects to make to various plans in 2012, of which
$900 million was contributed to the Company’s U.S. pension plans during the first quarter of 2012. The expected favorable impact
of this item will be partially offset by the expected unfavorable impact of a decrease in the weighted-average discount rate used to
calculate the Company’s benefit obligation. Refer to the heading ‘‘Liquidity, Capital Resources and Financial Position’’ below for
information related to these contributions. Refer to the heading ‘‘Critical Accounting Policies and Estimates — Pension Plan
Valuations’’ above and Note 13 of Notes to Consolidated Financial Statements for additional information related to the discount
rates used by the Company.
As of December 31, 2011, we had $516 million of total unrecognized compensation cost related to nonvested share-based
compensation arrangements granted under our plans. This cost is expected to be recognized over a weighted-average period of
1.8 years as stock-based compensation expense. This expected cost does not include the impact of any future stock-based
compensation awards. Refer to Note 12 of Notes to Consolidated Financial Statements.
Year Ended December 31, 2010, versus Year Ended December 31, 2009
Selling, general and administrative expenses increased $1,800 million, or 16 percent. Foreign currency fluctuations increased
selling, general and administrative expenses by 1 percent. The increase in stock-based compensation was primarily related to
higher payouts tied to performance in conjunction with our long-term incentive compensation programs and the impact of
modifications made to certain replacement performance share unit awards issued by the Company in connection with our
acquisition of CCE’s North American business. The Company modified primarily all of these replacement performance share unit
awards to eliminate the remaining holding period, which resulted in $74 million of accelerated expense in the fourth quarter of
2010. Refer to Note 2 of Notes to Consolidated Financial Statements. The increase in advertising expenses reflected the
Company’s continued investment in our brands and building market execution capabilities.
The increase in bottling and distribution expenses was primarily related to the impact of our acquisition of CCE’s North American
business and our continued investments in our other bottling operations. The unfavorable impact of these items was partially
offset by the deconsolidation of certain entities as a result of the Company’s adoption of new accounting guidance issued by the
FASB. These entities are primarily bottling operations and accounted for approximately 2 percent of the Company’s consolidated
selling, general and administrative expenses in 2009. Bottling and distribution expenses were also reduced due to the sale of our
Norwegian and Swedish bottling operations to New CCE. Refer to the heading ‘‘Structural Changes, Acquired Brands and New
License Agreements’’ above for additional information related to significant structural changes.
56