Coca Cola 2011 Annual Report Download - page 119
Download and view the complete annual report
Please find page 119 of the 2011 Coca Cola annual report below. You can navigate through the pages in the report by either clicking on the pages listed below, or by using the keyword search tool below to find specific information within the annual report.-
 1
1 -
2
-
3
-
4
-
5
-
6
-
7
-
8
-
9
-
10
-
11
-
12
-
13
-
14
-
15
-
16
-
17
-
18
-
19
-
20
-
21
-
22
-
23
-
24
-
25
-
26
-
27
-
28
-
29
-
30
-
31
-
32
-
33
-
34
-
35
-
36
-
37
-
38
-
39
-
40
-
41
-
42
-
43
-
44
-
45
-
46
-
47
-
48
-
49
-
50
-
51
-
52
-
53
-
54
-
55
-
56
-
57
-
58
-
59
-
60
-
61
-
62
-
63
-
64
-
65
-
66
-
67
-
68
-
69
-
70
-
71
-
72
-
73
-
74
-
75
-
76
-
77
-
78
-
79
-
80
-
81
-
82
-
83
-
84
-
85
-
86
-
87
-
88
-
89
-
90
-
91
-
92
-
93
-
94
-
95
-
96
-
97
-
98
-
99
-
100
-
101
-
102
-
103
-
104
-
105
-
106
-
107
-
108
-
 109
109 -
 110
110 -
 111
111 -
 112
112 -
 113
113 -
 114
114 -
 115
115 -
 116
116 -
 117
117 -
 118
118 -
 119
119 -
 120
120 -
 121
121 -
 122
122 -
 123
123 -
 124
124 -
 125
125 -
 126
126 -
 127
127 -
 128
128 -
 129
129 -
130
-
131
-
132
-
133
-
134
-
135
-
136
-
137
-
138
-
139
-
140
-
141
-
142
-
143
-
144
-
145
-
146
-
147
-
148
-
149
-
150
-
151
-
152
-
153
-
154
-
155
-
156
-
157
-
158
-
159
-
160
-
161
-
162
-
163
-
164
-
165
-
166
 |
 |

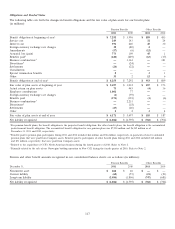
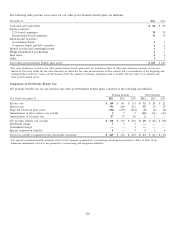
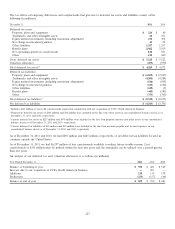
Obligations and Funded Status
The following table sets forth the changes in benefit obligations and the fair value of plan assets for our benefit plans
(in millions):
Pension Benefits Other Benefits
2011 2010 2011 2010
Benefit obligation at beginning of year1$ 7,292 $ 3,996 $ 889 $ 483
Service cost 249 143 32 24
Interest cost 391 260 45 30
Foreign currency exchange rate changes 30 (80) 2—
Amendments (57) (6) (12) —
Actuarial loss (gain) 773 109 45 1
Benefits paid2(440) (249) (63) (37)
Business combinations3—3,163 —381
Divestitures4—(24) ——
Settlements (24) (22) ——
Curtailments ————
Special termination benefits 8—31
Other 33 212 6
Benefit obligation at end of year1$ 8,255 $ 7,292 $ 953 $ 889
Fair value of plan assets at beginning of year $ 5,497 $ 3,032 $ 187 $ 173
Actual return on plan assets 73 445 (4) 16
Employer contributions 1,001 77 ——
Foreign currency exchange rate changes (1) (59) ——
Benefits paid (374) (193) (1) (6)
Business combinations3—2,231 ——
Divestitures4—(18) ——
Settlements (27) (20) ——
Other 2234
Fair value of plan assets at end of year $ 6,171 $ 5,497 $ 185 $ 187
Net liability recognized $ (2,084) $ (1,795) $ (768) $ (702)
1For pension benefit plans, the benefit obligation is the projected benefit obligation. For other benefit plans, the benefit obligation is the accumulated
postretirement benefit obligation. The accumulated benefit obligation for our pension plans was $7,958 million and $6,949 million as of
December 31, 2011 and 2010, respectively.
2Benefits paid to pension plan participants during 2011 and 2010 included $66 million and $56 million, respectively, in payments related to unfunded
pension plans that were paid from Company assets. Benefits paid to participants of other benefit plans during 2011 and 2010 included $62 million
and $31 million, respectively, that were paid from Company assets.
3Related to the acquisition of CCE’s North American business during the fourth quarter of 2010. Refer to Note 2.
4Primarily related to the sale of our Norwegian bottling operation to New CCE during the fourth quarter of 2010. Refer to Note 2.
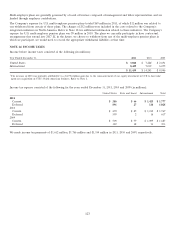
Pension and other benefit amounts recognized in our consolidated balance sheets are as follows (in millions):
Pension Benefits Other Benefits
December 31, 2011 2010 2011 2010
Noncurrent asset $ 468 $66 $— $—
Current liability (68) (55) (21) (21)
Long-term liability (2,484) (1,806) (747) (681)
Net liability recognized $ (2,084) $ (1,795) $ (768) $ (702)
117