Coca Cola 2011 Annual Report Download - page 62
Download and view the complete annual report
Please find page 62 of the 2011 Coca Cola annual report below. You can navigate through the pages in the report by either clicking on the pages listed below, or by using the keyword search tool below to find specific information within the annual report.-
 1
1 -
2
-
3
-
4
-
5
-
6
-
7
-
8
-
9
-
10
-
11
-
12
-
13
-
14
-
15
-
16
-
17
-
18
-
19
-
20
-
21
-
22
-
23
-
24
-
25
-
26
-
27
-
28
-
29
-
30
-
31
-
32
-
33
-
34
-
35
-
36
-
37
-
38
-
39
-
40
-
41
-
42
-
43
-
44
-
45
-
46
-
47
-
48
-
49
-
50
-
51
-
 52
52 -
 53
53 -
 54
54 -
 55
55 -
 56
56 -
 57
57 -
 58
58 -
 59
59 -
 60
60 -
 61
61 -
 62
62 -
 63
63 -
 64
64 -
 65
65 -
 66
66 -
 67
67 -
 68
68 -
 69
69 -
 70
70 -
 71
71 -
 72
72 -
73
-
74
-
75
-
76
-
77
-
78
-
79
-
80
-
81
-
82
-
83
-
84
-
85
-
86
-
87
-
88
-
89
-
90
-
91
-
92
-
93
-
94
-
95
-
96
-
97
-
98
-
99
-
100
-
101
-
102
-
103
-
104
-
105
-
106
-
107
-
108
-
109
-
110
-
111
-
112
-
113
-
114
-
115
-
116
-
117
-
118
-
119
-
120
-
121
-
122
-
123
-
124
-
125
-
126
-
127
-
128
-
129
-
130
-
131
-
132
-
133
-
134
-
135
-
136
-
137
-
138
-
139
-
140
-
141
-
142
-
143
-
144
-
145
-
146
-
147
-
148
-
149
-
150
-
151
-
152
-
153
-
154
-
155
-
156
-
157
-
158
-
159
-
160
-
161
-
162
-
163
-
164
-
165
-
166
 |
 |
• In 2011, operating income and operating margin for Latin America were favorably impacted by volume growth across all of
the group’s business units and pricing increases in key markets, partially offset by continued investments in the business.
• In 2011, the operating margin for North America was unfavorably impacted by the full year impact of the Company’s
acquisition of CCE’s North American business. Generally, bottling and finished products operations have higher net
operating revenues but lower operating margins when compared to concentrate and syrup operations. The impact of this
transaction was also reflected in the Company’s operating margin. Refer to the heading ‘‘Structural Changes, Acquired
Brands and New License Agreements’’ above.
• In 2011, operating income and operating margin for North America were unfavorably impacted by higher commodity costs
in the segment’s finished products businesses.
• In 2011, operating income was reduced by $19 million for North America due to the amortization of favorable supply
contracts acquired in connection with our acquisition of CCE’s North American business.
• In 2011, operating income and operating margin for Pacific and North America were unfavorably impacted as a result of
the earthquake and tsunami that devastated northern and eastern Japan on March 11, 2011. Operating income was reduced
by $82 million and $2 million for Pacific and North America, respectively. The charges were primarily related to the
Company’s charitable donations in support of relief and rebuilding efforts in Japan as well as funds we provided certain
bottling partners in the affected regions.
• In 2011, operating income was reduced by $10 million for Corporate due to charges associated with the floods in Thailand
that impacted the Company’s supply chain operations in the region.
• In 2011, operating income was reduced by $12 million for Eurasia and Africa, $25 million for Europe, $4 million for Latin
America, $374 million for North America, $4 million for Pacific, $89 million for Bottling Investments and $164 million for
Corporate, primarily due to the Company’s ongoing productivity, integration and restructuring initiatives as well as costs
associated with the merger of Arca and Contal.
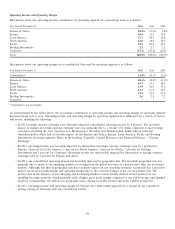
• In 2010, foreign currency exchange rates favorably impacted consolidated operating income by 3 percent. The favorable
impact of changes in foreign currency exchange rates was primarily due to a weaker U.S. dollar compared to most foreign
currencies, including the Japanese yen, Mexican peso, Brazilian real, South African rand and Australian dollar, which had a
favorable impact on the Eurasia and Africa, Latin America, Pacific and Bottling Investments operating segments. The
favorable impact of a weaker U.S. dollar compared to the aforementioned currencies was partially offset by the impact of a
stronger U.S. dollar compared to certain other foreign currencies, including the euro and British pound, which had an
unfavorable impact on the Europe and Bottling Investments operating segments. Refer to the heading ‘‘Liquidity, Capital
Resources and Financial Position — Foreign Exchange’’ below.
• In 2010, operating income was favorably impacted by fluctuations in foreign currency exchange rates by 7 percent for
Eurasia and Africa, 3 percent for Latin America, 8 percent for Pacific and 9 percent for Bottling Investments. Operating
income was unfavorably impacted by fluctuations in foreign currency exchange rates by 1 percent for Europe. Fluctuations
in foreign currency exchange rates had a nominal impact on operating income for North America and Corporate.
• In 2010, our consolidated operating margin was favorably impacted by geographic mix. The favorable geographic mix was
primarily due to many of our emerging markets recovering from the global recession at a quicker pace than our developed
markets. Although this shift in geographic mix has a negative impact on net operating revenues, it generally has a favorable
impact on our gross profit margin and operating margin due to the correlated impact it has on our product mix. The
product mix in the majority of our emerging and developing markets is more heavily skewed toward products in our
sparkling beverage portfolio, which generally yield a higher gross profit margin compared to our still beverages and finished
products.
• In 2010, our consolidated operating margin was favorably impacted by the deconsolidation of certain entities as a result of
the Company’s adoption of new accounting guidance issued by the FASB. These entities are primarily bottling operations
and have been accounted for under the equity method of accounting since they were deconsolidated on January 1, 2010.
Generally, bottling and finished products operations produce higher net revenues but lower operating margins compared to
concentrate and syrup operations. The majority of the deconsolidated entities had previously been included in our Bottling
Investments operating segment.
60