Coca Cola 2011 Annual Report Download - page 52
Download and view the complete annual report
Please find page 52 of the 2011 Coca Cola annual report below. You can navigate through the pages in the report by either clicking on the pages listed below, or by using the keyword search tool below to find specific information within the annual report.-
 1
1 -
2
-
3
-
4
-
5
-
6
-
7
-
8
-
9
-
10
-
11
-
12
-
13
-
14
-
15
-
16
-
17
-
18
-
19
-
20
-
21
-
22
-
23
-
24
-
25
-
26
-
27
-
28
-
29
-
30
-
31
-
32
-
33
-
34
-
35
-
36
-
37
-
38
-
39
-
40
-
41
-
 42
42 -
 43
43 -
 44
44 -
 45
45 -
 46
46 -
 47
47 -
 48
48 -
 49
49 -
 50
50 -
 51
51 -
 52
52 -
 53
53 -
 54
54 -
 55
55 -
 56
56 -
 57
57 -
 58
58 -
 59
59 -
 60
60 -
 61
61 -
 62
62 -
63
-
64
-
65
-
66
-
67
-
68
-
69
-
70
-
71
-
72
-
73
-
74
-
75
-
76
-
77
-
78
-
79
-
80
-
81
-
82
-
83
-
84
-
85
-
86
-
87
-
88
-
89
-
90
-
91
-
92
-
93
-
94
-
95
-
96
-
97
-
98
-
99
-
100
-
101
-
102
-
103
-
104
-
105
-
106
-
107
-
108
-
109
-
110
-
111
-
112
-
113
-
114
-
115
-
116
-
117
-
118
-
119
-
120
-
121
-
122
-
123
-
124
-
125
-
126
-
127
-
128
-
129
-
130
-
131
-
132
-
133
-
134
-
135
-
136
-
137
-
138
-
139
-
140
-
141
-
142
-
143
-
144
-
145
-
146
-
147
-
148
-
149
-
150
-
151
-
152
-
153
-
154
-
155
-
156
-
157
-
158
-
159
-
160
-
161
-
162
-
163
-
164
-
165
-
166
 |
 |
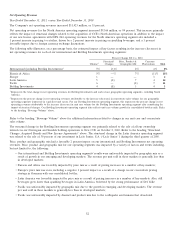
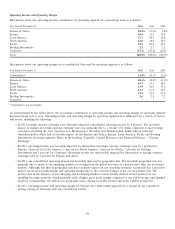
Included in Japan’s unit case volume growth was 5 percent growth in Trademark Coca-Cola, primarily due to strong FIFA World
CupTM activation programs and our Coca-Cola Summer Promotion. Japan’s unit case volume growth also benefited from
17 percent growth in sports drinks.
Unit case volume for Bottling Investments decreased 1 percent, primarily due to the deconsolidation of certain entities as a result
of the Company’s adoption of new accounting guidance issued by the FASB. These entities are primarily bottling operations and
have been accounted for under the equity method of accounting since they were deconsolidated on January 1, 2010. Refer to the
heading ‘‘Critical Accounting Policies and Estimates — Principles of Consolidation’’ and ‘‘Structural Changes, Acquired Brands
and New License Agreements’’ above. The deconsolidation of these entities negatively impacted the unit case volume for Bottling
Investments by approximately 9 percent. Unit case volume for Bottling Investments was also negatively impacted by the sale of
our Norwegian and Swedish bottling operations to New CCE. The unfavorable impact of the aforementioned items was partially
offset by growth in markets where we own or otherwise consolidate the bottling operations. Unit case volume grew 6 percent in
China, 17 percent in India, 15 percent in the Philippines and 1 percent in Germany. The Company’s consolidated bottling
operations account for 33 percent, 66 percent, 100 percent and 100 percent of the unit case volume in China, India, the
Philippines and Germany, respectively.
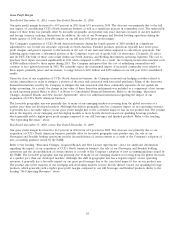
Concentrate Sales Volume
In 2011, concentrate sales volume and unit case volume both grew 5 percent compared to 2010. Likewise, in 2010, concentrate
sales volume and unit case volume both grew 5 percent compared to 2009. The differences between concentrate sales volume and
unit case volume growth rates for individual operating segments in 2011 and 2010 were primarily due to the timing of concentrate
shipments and the impact of unit case volume from certain joint ventures in which the Company has an equity interest, but to
which the Company does not sell concentrates, syrups, beverage bases or powders.
50