Coca Cola 2011 Annual Report Download - page 77
Download and view the complete annual report
Please find page 77 of the 2011 Coca Cola annual report below. You can navigate through the pages in the report by either clicking on the pages listed below, or by using the keyword search tool below to find specific information within the annual report.-
 1
1 -
2
-
3
-
4
-
5
-
6
-
7
-
8
-
9
-
10
-
11
-
12
-
13
-
14
-
15
-
16
-
17
-
18
-
19
-
20
-
21
-
22
-
23
-
24
-
25
-
26
-
27
-
28
-
29
-
30
-
31
-
32
-
33
-
34
-
35
-
36
-
37
-
38
-
39
-
40
-
41
-
42
-
43
-
44
-
45
-
46
-
47
-
48
-
49
-
50
-
51
-
52
-
53
-
54
-
55
-
56
-
57
-
58
-
59
-
60
-
61
-
62
-
63
-
64
-
65
-
66
-
 67
67 -
 68
68 -
 69
69 -
 70
70 -
 71
71 -
 72
72 -
 73
73 -
 74
74 -
 75
75 -
 76
76 -
 77
77 -
 78
78 -
 79
79 -
 80
80 -
 81
81 -
 82
82 -
 83
83 -
 84
84 -
 85
85 -
 86
86 -
 87
87 -
88
-
89
-
90
-
91
-
92
-
93
-
94
-
95
-
96
-
97
-
98
-
99
-
100
-
101
-
102
-
103
-
104
-
105
-
106
-
107
-
108
-
109
-
110
-
111
-
112
-
113
-
114
-
115
-
116
-
117
-
118
-
119
-
120
-
121
-
122
-
123
-
124
-
125
-
126
-
127
-
128
-
129
-
130
-
131
-
132
-
133
-
134
-
135
-
136
-
137
-
138
-
139
-
140
-
141
-
142
-
143
-
144
-
145
-
146
-
147
-
148
-
149
-
150
-
151
-
152
-
153
-
154
-
155
-
156
-
157
-
158
-
159
-
160
-
161
-
162
-
163
-
164
-
165
-
166
 |
 |

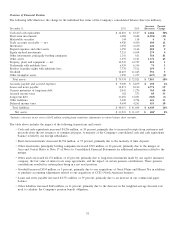
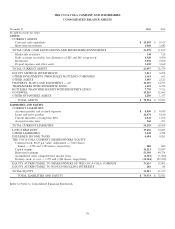
Overview of Financial Position
The following table illustrates the change in the individual line items of the Company’s consolidated balance sheet (in millions):
Increase Percent
December 31, 2011 2010 (Decrease) Change
Cash and cash equivalents $ 12,803 $ 8,517 $ 4,286 50%
Short-term investments 1,088 2,682 (1,594) (59)
Marketable securities 144 138 64
Trade accounts receivable — net 4,920 4,430 490 11
Inventories 3,092 2,650 442 17
Prepaid expenses and other assets 3,450 3,162 288 9
Equity method investments 7,233 6,954 279 4
Other investments, principally bottling companies 1,141 631 510 81
Other assets 3,495 2,121 1,374 65
Property, plant and equipment — net 14,939 14,727 212 1
Trademarks with indefinite lives 6,430 6,356 74 1
Bottlers’ franchise rights with indefinite lives 7,770 7,511 259 3
Goodwill 12,219 11,665 554 5
Other intangible assets 1,250 1,377 (127) (9)
Total assets $ 79,974 $ 72,921 $ 7,053 10%
Accounts payable and accrued expenses $ 9,009 $ 8,859 $ 150 2%
Loans and notes payable 12,871 8,100 4,771 59
Current maturities of long-term debt 2,041 1,276 765 60
Accrued income taxes 362 273 89 33
Long-term debt 13,656 14,041 (385) (3)
Other liabilities 5,420 4,794 626 13
Deferred income taxes 4,694 4,261 433 10
Total liabilities $ 48,053 $ 41,604 $ 6,449 16%
Net assets $ 31,921 $ 31,317 $ 60412%
1Includes a decrease in net assets of $692 million resulting from translation adjustments in various balance sheet accounts.
The table above includes the impact of the following transactions and events:
• Cash and cash equivalents increased $4,286 million, or 50 percent, primarily due to increased receipts from customers and
proceeds from the net issuances of commercial paper. A majority of the Company’s consolidated cash and cash equivalents
balance is held by our foreign subsidiaries.
• Short-term investments decreased $1,594 million, or 59 percent, primarily due to the maturity of time deposits.
• Other investments, principally bottling companies increased $510 million, or 81 percent, primarily due to the merger of
Arca and Contal. Refer to Note 17 of Notes to Consolidated Financial Statements for additional information related to the
merger.
• Other assets increased $1,374 million, or 65 percent, primarily due to long-term investments made by our captive insurance
company, the fair value of interest rate swap agreements, and the impact of certain pension contributions. These pension
contributions resulted in certain plans being in a net asset position.
• Goodwill increased $554 million, or 5 percent, primarily due to our acquisitions of Great Plains and Honest Tea in addition
to purchase accounting adjustments related to our acquisition of CCE’s North American business.
• Loans and notes payable increased $4,771 million, or 59 percent, primarily due to an increase in our commercial paper
balance.
• Other liabilities increased $626 million, or 13 percent, primarily due to the decrease in the weighted-average discount rate
used to calculate the Company’s pension benefit obligation.
75