Coca Cola 2011 Annual Report Download - page 63
Download and view the complete annual report
Please find page 63 of the 2011 Coca Cola annual report below. You can navigate through the pages in the report by either clicking on the pages listed below, or by using the keyword search tool below to find specific information within the annual report.-
 1
1 -
2
-
3
-
4
-
5
-
6
-
7
-
8
-
9
-
10
-
11
-
12
-
13
-
14
-
15
-
16
-
17
-
18
-
19
-
20
-
21
-
22
-
23
-
24
-
25
-
26
-
27
-
28
-
29
-
30
-
31
-
32
-
33
-
34
-
35
-
36
-
37
-
38
-
39
-
40
-
41
-
42
-
43
-
44
-
45
-
46
-
47
-
48
-
49
-
50
-
51
-
52
-
 53
53 -
 54
54 -
 55
55 -
 56
56 -
 57
57 -
 58
58 -
 59
59 -
 60
60 -
 61
61 -
 62
62 -
 63
63 -
 64
64 -
 65
65 -
 66
66 -
 67
67 -
 68
68 -
 69
69 -
 70
70 -
 71
71 -
 72
72 -
 73
73 -
74
-
75
-
76
-
77
-
78
-
79
-
80
-
81
-
82
-
83
-
84
-
85
-
86
-
87
-
88
-
89
-
90
-
91
-
92
-
93
-
94
-
95
-
96
-
97
-
98
-
99
-
100
-
101
-
102
-
103
-
104
-
105
-
106
-
107
-
108
-
109
-
110
-
111
-
112
-
113
-
114
-
115
-
116
-
117
-
118
-
119
-
120
-
121
-
122
-
123
-
124
-
125
-
126
-
127
-
128
-
129
-
130
-
131
-
132
-
133
-
134
-
135
-
136
-
137
-
138
-
139
-
140
-
141
-
142
-
143
-
144
-
145
-
146
-
147
-
148
-
149
-
150
-
151
-
152
-
153
-
154
-
155
-
156
-
157
-
158
-
159
-
160
-
161
-
162
-
163
-
164
-
165
-
166
 |
 |
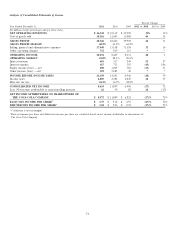
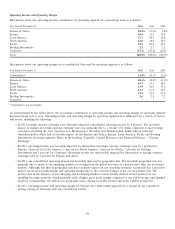
• In 2010, the operating margin for the Latin America operating segment was favorably impacted by the sale of 50 percent of
our ownership interest in Le˜
ao Junior, resulting in its deconsolidation, as well as the deconsolidation of certain entities as a
result of the Company’s adoption of new accounting guidance issued by the FASB. Price and product mix also favorably
impacted Latin America’s operating income and operating margin during the year.
• In 2010, the operating margin for the North America operating segment was unfavorably impacted by the Company’s
acquisition of CCE’s North American business. Generally, bottling and finished products operations have higher net
operating revenues but lower operating margins when compared to concentrate and syrup operations. Refer to the heading
‘‘Structural Changes, Acquired Brands and New License Agreements’’ above.
• In 2010, operating income for the North America operating segment was reduced by $74 million due to the acceleration of
expense associated with certain share-based replacement awards issued in connection with our acquisition of CCE’s North
American business. Refer to Note 2 of Notes to Consolidated Financial Statements.
• In 2010, operating income for the North America operating segment was negatively impacted by $235 million, primarily due
to the elimination of gross profit in inventory on intercompany sales and an inventory fair value adjustment as a result of
our acquisition of CCE’s North American business. Prior to the acquisition, we recognized the profit associated with
concentrate sales when the concentrate was sold to CCE, excluding the portion that was deemed to be intercompany due to
our previous ownership interest in CCE. However, subsequent to the acquisition, the Company does not recognize the
profit associated with concentrate sold to CCE’s legacy North American business until the finished beverage products made
from those concentrates are sold.
• In 2010, operating income for the North America operating segment was reduced by $20 million due to the amortization of
favorable supply contracts acquired in connection with our acquisition of CCE’s North American business.
• In 2010, operating income was reduced by $7 million for Eurasia and Africa, $50 million for Europe, $133 million for
North America, $22 million for Pacific, $122 million for Bottling Investments and $485 million for Corporate, primarily due
to the Company’s productivity, integration and restructuring initiatives; charitable donations; transaction costs incurred in
connection with our acquisition of CCE’s North American business and the sale of our Norwegian and Swedish bottling
operations to New CCE; and other charges related to bottling activities in Eurasia. Refer to the heading ‘‘Other Operating
Charges’’ above.
• In 2009, operating income was reduced by $4 million for Eurasia and Africa, $7 million for Europe, $31 million for North
America, $1 million for Pacific, $141 million for Bottling Investments and $129 million for Corporate, primarily as a result
of restructuring costs, the Company’s ongoing productivity initiatives and asset impairments. Refer to the heading ‘‘Other
Operating Charges’’ above.
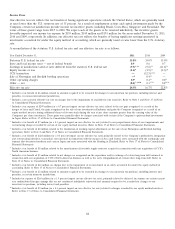
Interest Income
Year Ended December 31, 2011, versus Year Ended December 31, 2010
Interest income was $483 million in 2011, compared to $317 million in 2010, an increase of $166 million, or 52 percent. The
increase was primarily due to the impact of higher average cash, cash equivalents and short-term investment balances in addition
to higher average interest rates, particularly in international locations. The majority of our cash, cash equivalents and short-term
investments are held by our international locations.
Year Ended December 31, 2010, versus Year Ended December 31, 2009
Interest income was $317 million in 2010, compared to $249 million in 2009, an increase of $68 million, or 27 percent. The
increase was primarily due to the impact of higher average cash and short-term investment balances, partially offset by lower
average interest rates.
Interest Expense
Year Ended December 31, 2011, versus Year Ended December 31, 2010
Interest expense was $417 million in 2011, compared to $733 million in 2010, a decrease of $316 million, or 43 percent. The
decrease was primarily due to a $342 million charge recorded in 2010 related to debt assumed in connection with the Company’s
acquisition of CCE’s North American business. See prior year’s discussion below for further information related to the charge
recorded during 2010. This decrease was partially offset by the full year impact of increased interest expense on long-term debt
assumed in connection with the CCE acquisition as well as additional long-term debt issued by the Company in 2011. The
Company’s interest expense also includes the impact of interest rate swap agreements. Refer to Note 5 of Notes to Consolidated
Financial Statements for additional information related to our interest rate swaps.
61