Coca Cola 2011 Annual Report Download - page 120
Download and view the complete annual report
Please find page 120 of the 2011 Coca Cola annual report below. You can navigate through the pages in the report by either clicking on the pages listed below, or by using the keyword search tool below to find specific information within the annual report.-
 1
1 -
2
-
3
-
4
-
5
-
6
-
7
-
8
-
9
-
10
-
11
-
12
-
13
-
14
-
15
-
16
-
17
-
18
-
19
-
20
-
21
-
22
-
23
-
24
-
25
-
26
-
27
-
28
-
29
-
30
-
31
-
32
-
33
-
34
-
35
-
36
-
37
-
38
-
39
-
40
-
41
-
42
-
43
-
44
-
45
-
46
-
47
-
48
-
49
-
50
-
51
-
52
-
53
-
54
-
55
-
56
-
57
-
58
-
59
-
60
-
61
-
62
-
63
-
64
-
65
-
66
-
67
-
68
-
69
-
70
-
71
-
72
-
73
-
74
-
75
-
76
-
77
-
78
-
79
-
80
-
81
-
82
-
83
-
84
-
85
-
86
-
87
-
88
-
89
-
90
-
91
-
92
-
93
-
94
-
95
-
96
-
97
-
98
-
99
-
100
-
101
-
102
-
103
-
104
-
105
-
106
-
107
-
108
-
109
-
 110
110 -
 111
111 -
 112
112 -
 113
113 -
 114
114 -
 115
115 -
 116
116 -
 117
117 -
 118
118 -
 119
119 -
 120
120 -
 121
121 -
 122
122 -
 123
123 -
 124
124 -
 125
125 -
 126
126 -
 127
127 -
 128
128 -
 129
129 -
 130
130 -
131
-
132
-
133
-
134
-
135
-
136
-
137
-
138
-
139
-
140
-
141
-
142
-
143
-
144
-
145
-
146
-
147
-
148
-
149
-
150
-
151
-
152
-
153
-
154
-
155
-
156
-
157
-
158
-
159
-
160
-
161
-
162
-
163
-
164
-
165
-
166
 |
 |

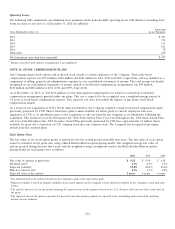
Effective January 1, 2010, the Company’s existing primary U.S. pension plan was transitioned from a traditional final average pay
formula to a cash balance formula. In general, employees may receive credits based on age, service, pay and interest under the
new method. The primary pension plan acquired by the Company in connection with our acquisition of CCE’s North American
business transitioned to a cash balance formula in 2011.
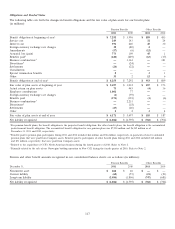
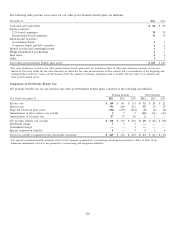
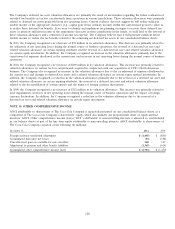
Certain of our pension plans have projected benefit obligations in excess of the fair value of plan assets. For these plans, the
projected benefit obligations and the fair value of plan assets were as follows (in millions):
December 31, 2011 2010
Projected benefit obligation $ 7,591 $ 7,024
Fair value of plan assets 5,048 5,172
Certain of our pension plans have accumulated benefit obligations in excess of the fair value of plan assets. For these plans, the
accumulated benefit obligations and the fair value of plan assets were as follows (in millions):
December 31, 2011 2010
Accumulated benefit obligation $ 7,277 $ 6,503
Fair value of plan assets 4,998 4,981
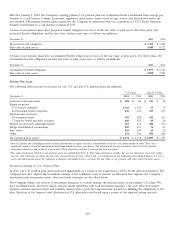
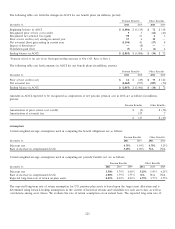
Pension Plan Assets
The following table presents total assets for our U.S. and non-U.S. pension plans (in millions):
U.S. Plans Non-U.S. Plans
December 31, 2011 2010 2011 2010
Cash and cash equivalents $ 104 $88$ 123 $38
Equity securities:
U.S.-based companies 1,362 1,324 33 30
International-based companies 630 631 323 107
Fixed-income securities:
Government bonds 358 268 415 163
Corporate bonds and debt securities 669 625 49 20
Mutual, pooled and commingled funds1323 431 406 700
Hedge funds/limited partnerships 458 415 31 23
Real estate 256 230 14 12
Other 114 106 503 286
Total pension plan assets2$ 4,274 $ 4,118 $ 1,897 $ 1,379
1Mutual, pooled and commingled funds include investments in equity securities, fixed-income securities and combinations of both. There are a
significant number of mutual and pooled funds from which investors can choose. The selection of the type of fund is dictated by the specific
investment objectives and needs of a given plan. These objectives and needs vary greatly between plans.
2Fair value disclosures related to our pension assets are included in Note 16. Fair value disclosures include, but are not limited to, the levels within
the fair value hierarchy on which the fair value measurements in their entirety fall, a reconciliation of the beginning and ending balances of Level 3
assets and information about the valuation techniques and inputs used to measure the fair value of our pension and other postretirement assets.
Investment Strategy for U.S. Pension Plans
In 2010, our U.S. pension plan assets increased significantly as a result of our acquisition of CCE’s North American business. The
Company has since aligned the investment strategy of the combined assets to provide an allocation that supports the Company’s
investment goals for pension assets. Our investment strategies are described below.
The Company utilizes the services of investment managers to actively manage the pension assets of our primary U.S. plans. We
have established asset allocation targets and investment guidelines with each investment manager. Our asset allocation targets
promote optimal expected return and volatility characteristics given the long-term time horizon for fulfilling the obligations of the
plan. Selection of the targeted asset allocation for U.S. plan assets was based upon a review of the expected return and risk
118