Coca Cola 2011 Annual Report Download - page 82
Download and view the complete annual report
Please find page 82 of the 2011 Coca Cola annual report below. You can navigate through the pages in the report by either clicking on the pages listed below, or by using the keyword search tool below to find specific information within the annual report.-
 1
1 -
2
-
3
-
4
-
5
-
6
-
7
-
8
-
9
-
10
-
11
-
12
-
13
-
14
-
15
-
16
-
17
-
18
-
19
-
20
-
21
-
22
-
23
-
24
-
25
-
26
-
27
-
28
-
29
-
30
-
31
-
32
-
33
-
34
-
35
-
36
-
37
-
38
-
39
-
40
-
41
-
42
-
43
-
44
-
45
-
46
-
47
-
48
-
49
-
50
-
51
-
52
-
53
-
54
-
55
-
56
-
57
-
58
-
59
-
60
-
61
-
62
-
63
-
64
-
65
-
66
-
67
-
68
-
69
-
70
-
71
-
 72
72 -
 73
73 -
 74
74 -
 75
75 -
 76
76 -
 77
77 -
 78
78 -
 79
79 -
 80
80 -
 81
81 -
 82
82 -
 83
83 -
 84
84 -
 85
85 -
 86
86 -
 87
87 -
 88
88 -
 89
89 -
 90
90 -
 91
91 -
 92
92 -
93
-
94
-
95
-
96
-
97
-
98
-
99
-
100
-
101
-
102
-
103
-
104
-
105
-
106
-
107
-
108
-
109
-
110
-
111
-
112
-
113
-
114
-
115
-
116
-
117
-
118
-
119
-
120
-
121
-
122
-
123
-
124
-
125
-
126
-
127
-
128
-
129
-
130
-
131
-
132
-
133
-
134
-
135
-
136
-
137
-
138
-
139
-
140
-
141
-
142
-
143
-
144
-
145
-
146
-
147
-
148
-
149
-
150
-
151
-
152
-
153
-
154
-
155
-
156
-
157
-
158
-
159
-
160
-
161
-
162
-
163
-
164
-
165
-
166
 |
 |

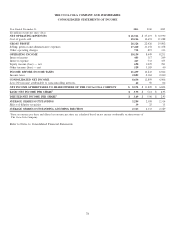
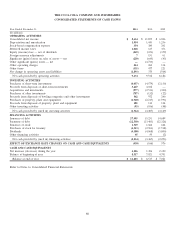
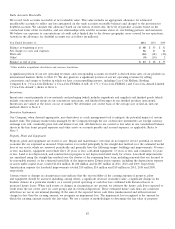
THE COCA-COLA COMPANY AND SUBSIDIARIES
CONSOLIDATED STATEMENTS OF CASH FLOWS
Year Ended December 31, 2011 2010 2009
(In millions)
OPERATING ACTIVITIES
Consolidated net income $ 8,634 $ 11,859 $ 6,906
Depreciation and amortization 1,954 1,443 1,236
Stock-based compensation expense 354 380 241
Deferred income taxes 1,028 617 353
Equity (income) loss — net of dividends (269) (671) (359)
Foreign currency adjustments 7151 61
Significant (gains) losses on sales of assets — net (220) (645) (43)
Other significant (gains) losses — net —(4,713) —
Other operating charges 214 264 134
Other items (335) 477 221
Net change in operating assets and liabilities (1,893) 370 (564)
Net cash provided by operating activities 9,474 9,532 8,186
INVESTING ACTIVITIES
Purchases of short-term investments (4,057) (4,579) (2,130)
Proceeds from disposals of short-term investments 5,647 4,032 —
Acquisitions and investments (977) (2,511) (300)
Purchases of other investments (787) (132) (22)
Proceeds from disposals of bottling companies and other investments 562 972 240
Purchases of property, plant and equipment (2,920) (2,215) (1,993)
Proceeds from disposals of property, plant and equipment 101 134 104
Other investing activities (93) (106) (48)
Net cash provided by (used in) investing activities (2,524) (4,405) (4,149)
FINANCING ACTIVITIES
Issuances of debt 27,495 15,251 14,689
Payments of debt (22,530) (13,403) (12,326)
Issuances of stock 1,569 1,666 664
Purchases of stock for treasury (4,513) (2,961) (1,518)
Dividends (4,300) (4,068) (3,800)
Other financing activities 45 50 (2)
Net cash provided by (used in) financing activities (2,234) (3,465) (2,293)
EFFECT OF EXCHANGE RATE CHANGES ON CASH AND CASH EQUIVALENTS (430) (166) 576
CASH AND CASH EQUIVALENTS
Net increase (decrease) during the year 4,286 1,496 2,320
Balance at beginning of year 8,517 7,021 4,701
Balance at end of year $ 12,803 $ 8,517 $ 7,021
Refer to Notes to Consolidated Financial Statements.
80