Coca Cola 2011 Annual Report Download - page 99
Download and view the complete annual report
Please find page 99 of the 2011 Coca Cola annual report below. You can navigate through the pages in the report by either clicking on the pages listed below, or by using the keyword search tool below to find specific information within the annual report.-
 1
1 -
2
-
3
-
4
-
5
-
6
-
7
-
8
-
9
-
10
-
11
-
12
-
13
-
14
-
15
-
16
-
17
-
18
-
19
-
20
-
21
-
22
-
23
-
24
-
25
-
26
-
27
-
28
-
29
-
30
-
31
-
32
-
33
-
34
-
35
-
36
-
37
-
38
-
39
-
40
-
41
-
42
-
43
-
44
-
45
-
46
-
47
-
48
-
49
-
50
-
51
-
52
-
53
-
54
-
55
-
56
-
57
-
58
-
59
-
60
-
61
-
62
-
63
-
64
-
65
-
66
-
67
-
68
-
69
-
70
-
71
-
72
-
73
-
74
-
75
-
76
-
77
-
78
-
79
-
80
-
81
-
82
-
83
-
84
-
85
-
86
-
87
-
88
-
 89
89 -
 90
90 -
 91
91 -
 92
92 -
 93
93 -
 94
94 -
 95
95 -
 96
96 -
 97
97 -
 98
98 -
 99
99 -
 100
100 -
 101
101 -
 102
102 -
 103
103 -
 104
104 -
 105
105 -
 106
106 -
 107
107 -
 108
108 -
 109
109 -
110
-
111
-
112
-
113
-
114
-
115
-
116
-
117
-
118
-
119
-
120
-
121
-
122
-
123
-
124
-
125
-
126
-
127
-
128
-
129
-
130
-
131
-
132
-
133
-
134
-
135
-
136
-
137
-
138
-
139
-
140
-
141
-
142
-
143
-
144
-
145
-
146
-
147
-
148
-
149
-
150
-
151
-
152
-
153
-
154
-
155
-
156
-
157
-
158
-
159
-
160
-
161
-
162
-
163
-
164
-
165
-
166
 |
 |

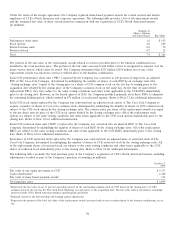
In 2011, the Company divested certain available-for-sale securities. These divestitures resulted in cash proceeds of $37 million,
gross realized gains of $5 million and gross realized losses of $1 million. In addition to the sale of available-for-sale securities, the
Company also had investments classified as available-for-sale securities in which our cost basis exceeded the fair value of our
investment. Management assessed each of these investments on an individual basis to determine if the decline in fair value was
other than temporary. Management’s assessment as to the nature of a decline in fair value is based on, among other things, the
length of time and the extent to which the market value has been less than our cost basis; the financial condition and near-term
prospects of the issuer; and our intent and ability to retain the investment for a period of time sufficient to allow for any
anticipated recovery in market value. Based on these assessments, management determined that the decline in fair value of certain
investments was other than temporary. As a result, the Company recognized other-than-temporary impairment charges of
$17 million. These impairment charges were recorded in other income (loss) — net. Refer to Note 16 and Note 17.
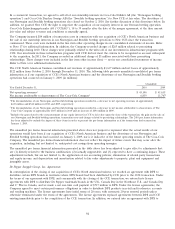
In 2010, the Company had several investments classified as available-for-sale securities in which our cost basis exceeded the fair
value of the investment. Management assessed each of these investments on an individual basis to determine if the decline in fair
value was other than temporary. Based on these assessments, management determined that the decline in fair value of certain
investments was other than temporary. As a result, the Company recognized other-than-temporary impairment charges of
$26 million. These impairment charges were recorded in other income (loss) — net. Refer to Note 16 and Note 17. The Company
did not sell any available-for-sale securities during 2010.
In 2009, the Company divested certain available-for-sale securities. These divestitures were the result of both sales and a
charitable donation. The sales of available-for-sale securities resulted in cash proceeds of $157 million, gross realized gains of
$44 million and gross realized losses of $2 million. In addition to the sale of available-for-sale securities, the Company donated
certain available-for-sale securities to The Coca-Cola Foundation. The donated investments had a cost basis of $7 million and a
fair value of $106 million at the date of donation. The net impact of this donation was an expense equal to our cost basis in the
securities, which was recorded in other income (loss) — net.
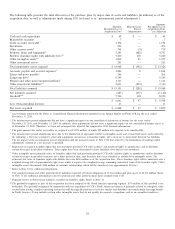
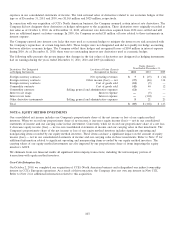
The Company’s available-for-sale and held-to-maturity securities were included in the following captions in our consolidated
balance sheets (in millions):
December 31, 2011 December 31, 2010
Available- Held-to- Available- Held-to-
for-Sale Maturity for-Sale Maturity
Securities Securities Securities Securities
Cash and cash equivalents $ — $ 112 $ — $ 110
Marketable securities 5151
Other investments, principally bottling companies 986 — 471 —
Other assets 410 — 9—
$ 1,401 $ 113 $ 485 $ 111
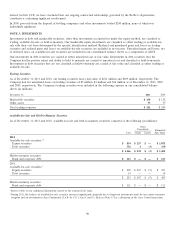
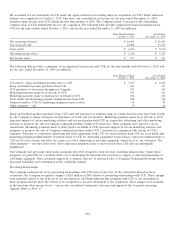
The contractual maturities of these investments as of December 31, 2011, were as follows (in millions):
Available-for-Sale Securities Held-to-Maturity Securities
Cost Fair Value Amortized Cost Fair Value
Within 1 year $ 5 $ 5 $ 113 $ 113
After 1 year through 5 years 32 32 — —
After 5 years through 10 years 191 191 — —
After 10 years 104 102 — —
Equity securities 834 1,071 — —
$ 1,166 $ 1,401 $ 113 $ 113
The Company expects that actual maturities may differ from the contractual maturities above because borrowers have the right to
call or prepay certain obligations.
Cost Method Investments
Cost method investments are originally recorded at cost, and we record dividend income when applicable dividends are
declared. Cost method investments are reported as other investments in our consolidated balance sheets, and dividend income
from cost method investments is reported in other income (loss) — net in our consolidated statements of income. We review
all of our cost method investments quarterly to determine if impairment indicators are present; however, we are not required
to determine the fair value of these investments unless impairment indicators exist. When impairment indicators exist, we
97