Coca Cola 2011 Annual Report Download - page 98
Download and view the complete annual report
Please find page 98 of the 2011 Coca Cola annual report below. You can navigate through the pages in the report by either clicking on the pages listed below, or by using the keyword search tool below to find specific information within the annual report.-
 1
1 -
2
-
3
-
4
-
5
-
6
-
7
-
8
-
9
-
10
-
11
-
12
-
13
-
14
-
15
-
16
-
17
-
18
-
19
-
20
-
21
-
22
-
23
-
24
-
25
-
26
-
27
-
28
-
29
-
30
-
31
-
32
-
33
-
34
-
35
-
36
-
37
-
38
-
39
-
40
-
41
-
42
-
43
-
44
-
45
-
46
-
47
-
48
-
49
-
50
-
51
-
52
-
53
-
54
-
55
-
56
-
57
-
58
-
59
-
60
-
61
-
62
-
63
-
64
-
65
-
66
-
67
-
68
-
69
-
70
-
71
-
72
-
73
-
74
-
75
-
76
-
77
-
78
-
79
-
80
-
81
-
82
-
83
-
84
-
85
-
86
-
87
-
 88
88 -
 89
89 -
 90
90 -
 91
91 -
 92
92 -
 93
93 -
 94
94 -
 95
95 -
 96
96 -
 97
97 -
 98
98 -
 99
99 -
 100
100 -
 101
101 -
 102
102 -
 103
103 -
 104
104 -
 105
105 -
 106
106 -
 107
107 -
 108
108 -
109
-
110
-
111
-
112
-
113
-
114
-
115
-
116
-
117
-
118
-
119
-
120
-
121
-
122
-
123
-
124
-
125
-
126
-
127
-
128
-
129
-
130
-
131
-
132
-
133
-
134
-
135
-
136
-
137
-
138
-
139
-
140
-
141
-
142
-
143
-
144
-
145
-
146
-
147
-
148
-
149
-
150
-
151
-
152
-
153
-
154
-
155
-
156
-
157
-
158
-
159
-
160
-
161
-
162
-
163
-
164
-
165
-
166
 |
 |
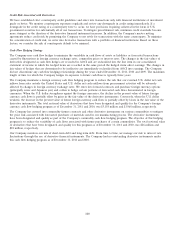
interest in New CCE, we have concluded that our ongoing contractual relationship, governed by the Bottler’s Agreements,
constitutes a continuing significant involvement.
In 2009, proceeds from the disposal of bottling companies and other investments totaled $240 million, none of which was
individually significant.
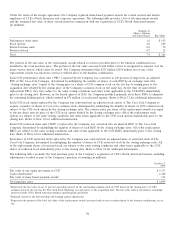
NOTE 3: INVESTMENTS
Investments in debt and marketable securities, other than investments accounted for under the equity method, are classified as
trading, available-for-sale or held-to-maturity. Our marketable equity investments are classified as either trading or available-for-
sale with their cost basis determined by the specific identification method. Realized and unrealized gains and losses on trading
securities and realized gains and losses on available-for-sale securities are included in net income. Unrealized gains and losses, net
of deferred taxes, on available-for-sale securities are included in our consolidated balance sheets as a component of AOCI.
Our investments in debt securities are carried at either amortized cost or fair value. Investments in debt securities that the
Company has the positive intent and ability to hold to maturity are carried at amortized cost and classified as held-to-maturity.
Investments in debt securities that are not classified as held-to-maturity are carried at fair value and classified as either trading or
available-for-sale.
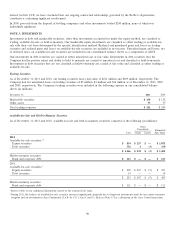
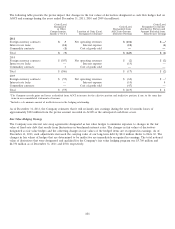
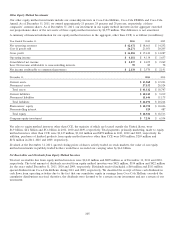
Trading Securities
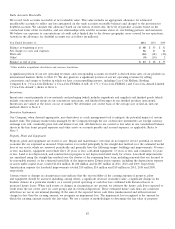
As of December 31, 2011 and 2010, our trading securities had a fair value of $211 million and $209 million, respectively. The
Company had net unrealized losses on trading securities of $5 million, $3 million and $16 million as of December 31, 2011, 2010
and 2009, respectively. The Company’s trading securities were included in the following captions in our consolidated balance
sheets (in millions):
December 31, 2011 2010
Marketable securities $ 138 $ 132
Other assets 73 77
Total trading securities $ 211 $ 209
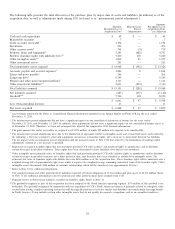
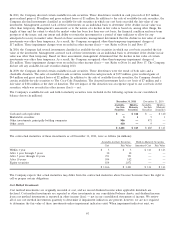
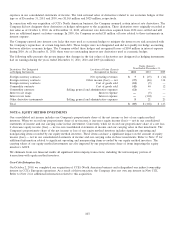
Available-for-Sale and Held-to-Maturity Securities
As of December 31, 2011 and 2010, available-for-sale and held-to-maturity securities consisted of the following (in millions):
Gross
Unrealized Estimated
Cost Gains Losses Fair Value
2011
Available-for-sale securities:1,2
Equity securities $ 834 $ 237 $ — $ 1,071
Debt securities 332 1 (3) 330
$ 1,166 $ 238 $ (3) $ 1,401
Held-to-maturity securities:
Bank and corporate debt $ 113 $ — $ — $ 113
2010
Available-for-sale securities:1
Equity securities $ 209 $ 267 $ (5) $ 471
Debt securities 14 — — 14
$ 223 $ 267 $ (5) $ 485
Held-to-maturity securities:
Bank and corporate debt $ 111 $ — $ — $ 111
1Refer to Note 16 for additional information related to the estimated fair value.
2During 2011, the balance of available-for-sale securities increased significantly, primarily due to long-term investments made by our captive insurance
company and an investment in Arca Continental, S.A.B. de C.V. (‘‘Arca Contal’’). Refer to Note 17 for a discussion of the Arca Contal transaction.
96