Coca Cola 2011 Annual Report Download - page 103
Download and view the complete annual report
Please find page 103 of the 2011 Coca Cola annual report below. You can navigate through the pages in the report by either clicking on the pages listed below, or by using the keyword search tool below to find specific information within the annual report.-
 1
1 -
2
-
3
-
4
-
5
-
6
-
7
-
8
-
9
-
10
-
11
-
12
-
13
-
14
-
15
-
16
-
17
-
18
-
19
-
20
-
21
-
22
-
23
-
24
-
25
-
26
-
27
-
28
-
29
-
30
-
31
-
32
-
33
-
34
-
35
-
36
-
37
-
38
-
39
-
40
-
41
-
42
-
43
-
44
-
45
-
46
-
47
-
48
-
49
-
50
-
51
-
52
-
53
-
54
-
55
-
56
-
57
-
58
-
59
-
60
-
61
-
62
-
63
-
64
-
65
-
66
-
67
-
68
-
69
-
70
-
71
-
72
-
73
-
74
-
75
-
76
-
77
-
78
-
79
-
80
-
81
-
82
-
83
-
84
-
85
-
86
-
87
-
88
-
89
-
90
-
91
-
92
-
 93
93 -
 94
94 -
 95
95 -
 96
96 -
 97
97 -
 98
98 -
 99
99 -
 100
100 -
 101
101 -
 102
102 -
 103
103 -
 104
104 -
 105
105 -
 106
106 -
 107
107 -
 108
108 -
 109
109 -
 110
110 -
 111
111 -
 112
112 -
 113
113 -
114
-
115
-
116
-
117
-
118
-
119
-
120
-
121
-
122
-
123
-
124
-
125
-
126
-
127
-
128
-
129
-
130
-
131
-
132
-
133
-
134
-
135
-
136
-
137
-
138
-
139
-
140
-
141
-
142
-
143
-
144
-
145
-
146
-
147
-
148
-
149
-
150
-
151
-
152
-
153
-
154
-
155
-
156
-
157
-
158
-
159
-
160
-
161
-
162
-
163
-
164
-
165
-
166
 |
 |

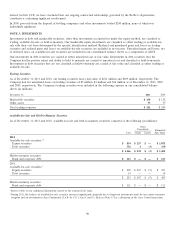
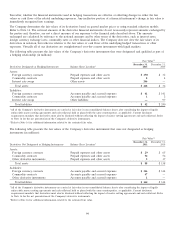
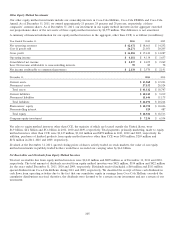
The following table presents the pretax impact that changes in the fair values of derivatives designated as cash flow hedges had on
AOCI and earnings during the years ended December 31, 2011, 2010 and 2009 (in millions):
Gain (Loss) Gain (Loss)
Recognized Gain (Loss) Recognized in Income
in Other Reclassified from (Ineffective Portion and
Comprehensive Location of Gain (Loss) AOCI into Income Amount Excluded from
Income (‘‘OCI’’) Recognized in Income1(Effective Portion) Effectiveness Testing)
2011
Foreign currency contracts $3 Net operating revenues $ (231) $ —2
Interest rate locks (11) Interest expense (12) (1)
Commodity contracts (1) Cost of goods sold ——
Total $ (9) $ (243) $ (1)
2010
Foreign currency contracts $ (307) Net operating revenues $ (2) $ (2)
Interest rate locks — Interest expense (15) —
Commodity contracts 1 Cost of goods sold — —
Total $ (306) $ (17) $ (2)
2009
Foreign currency contracts $ (59) Net operating revenues $ (62) $ —2
Interest rate locks — Interest expense (10) 4
Commodity contracts — Cost of goods sold (47) —
Total $ (59) $ (119) $ 4
1The Company records gains and losses reclassified from AOCI in income for the effective portion and ineffective portion, if any, to the same line
items in our consolidated statements of income.
2Includes a de minimis amount of ineffectiveness in the hedging relationship.
As of December 31, 2011, the Company estimates that it will reclassify into earnings during the next 12 months losses of
approximately $102 million from the pretax amount recorded in AOCI as the anticipated cash flows occur.
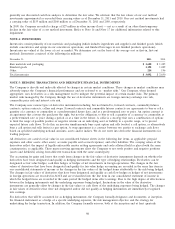
Fair Value Hedging Strategy
The Company uses interest rate swap agreements designated as fair value hedges to minimize exposure to changes in the fair
value of fixed-rate debt that results from fluctuations in benchmark interest rates. The changes in fair values of derivatives
designated as fair value hedges and the offsetting changes in fair values of the hedged items are recognized in earnings. As of
December 31, 2011, such adjustments increased the carrying value of our long-term debt by $231 million. Refer to Note 10. The
changes in fair values of hedges that are determined to be ineffective are immediately recognized in earnings. The total notional
value of derivatives that were designated and qualified for the Company’s fair value hedging program was $5,700 million and
$4,750 million as of December 31, 2011 and 2010, respectively.
101