Coca Cola 2011 Annual Report Download - page 131
Download and view the complete annual report
Please find page 131 of the 2011 Coca Cola annual report below. You can navigate through the pages in the report by either clicking on the pages listed below, or by using the keyword search tool below to find specific information within the annual report.-
 1
1 -
2
-
3
-
4
-
5
-
6
-
7
-
8
-
9
-
10
-
11
-
12
-
13
-
14
-
15
-
16
-
17
-
18
-
19
-
20
-
21
-
22
-
23
-
24
-
25
-
26
-
27
-
28
-
29
-
30
-
31
-
32
-
33
-
34
-
35
-
36
-
37
-
38
-
39
-
40
-
41
-
42
-
43
-
44
-
45
-
46
-
47
-
48
-
49
-
50
-
51
-
52
-
53
-
54
-
55
-
56
-
57
-
58
-
59
-
60
-
61
-
62
-
63
-
64
-
65
-
66
-
67
-
68
-
69
-
70
-
71
-
72
-
73
-
74
-
75
-
76
-
77
-
78
-
79
-
80
-
81
-
82
-
83
-
84
-
85
-
86
-
87
-
88
-
89
-
90
-
91
-
92
-
93
-
94
-
95
-
96
-
97
-
98
-
99
-
100
-
101
-
102
-
103
-
104
-
105
-
106
-
107
-
108
-
109
-
110
-
111
-
112
-
113
-
114
-
115
-
116
-
117
-
118
-
119
-
120
-
 121
121 -
 122
122 -
 123
123 -
 124
124 -
 125
125 -
 126
126 -
 127
127 -
 128
128 -
 129
129 -
 130
130 -
 131
131 -
 132
132 -
 133
133 -
 134
134 -
 135
135 -
 136
136 -
 137
137 -
 138
138 -
 139
139 -
 140
140 -
 141
141 -
142
-
143
-
144
-
145
-
146
-
147
-
148
-
149
-
150
-
151
-
152
-
153
-
154
-
155
-
156
-
157
-
158
-
159
-
160
-
161
-
162
-
163
-
164
-
165
-
166
 |
 |

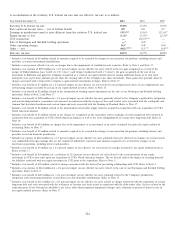
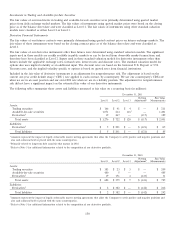
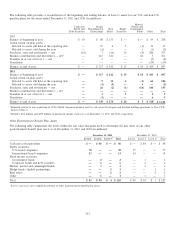
OCI attributable to shareowners of The Coca-Cola Company, including our proportionate share of equity method investees’ OCI,
for the years ended December 31, 2011, 2010 and 2009, is as follows (in millions):
Before-Tax Income After-Tax
Amount Tax Amount
2011
Net foreign currency translation adjustment $ (639) $ (1) $ (640)
Net gain (loss) on derivatives1240 (95) 145
Net change in unrealized gain on available-for-sale securities 6 (13) (7)
Net change in pension and other benefit liabilities (1,156) 405 (751)
Other comprehensive income (loss) $ (1,549) $ 296 $ (1,253)
2010
Net foreign currency translation adjustment $ (966) $ 31 $ (935)
Net gain (loss) on derivatives1(222) 102 (120)
Net change in unrealized gain on available-for-sale securities 133 (31) 102
Net change in pension and other benefit liabilities 396 (136) 260
Other comprehensive income (loss) $ (659) $ (34) $ (693)
2009
Net foreign currency translation adjustment $ 1,968 $ (144) $ 1,824
Net gain (loss) on derivatives158 (24) 34
Net change in unrealized gain on available-for-sale securities2(39) (13) (52)
Net change in pension and other benefit liabilities 173 (62) 111
Other comprehensive income (loss) $ 2,160 $ (243) $ 1,917
1Refer to Note 5 for information related to the net gain or loss on derivative instruments designated and qualifying as cash flow hedging instruments.
2Includes reclassification adjustments related to divestitures of certain available-for-sale securities. Refer to Note 3 for additional information related
to these divestitures.
NOTE 16: FAIR VALUE MEASUREMENTS
Accounting principles generally accepted in the United States define fair value as the exchange price that would be received for
an asset or paid to transfer a liability (an exit price) in the principal or most advantageous market for the asset or liability in an
orderly transaction between market participants at the measurement date. Additionally, the inputs used to measure fair value are
prioritized based on a three-level hierarchy. This hierarchy requires entities to maximize the use of observable inputs and
minimize the use of unobservable inputs. The three levels of inputs used to measure fair value are as follows:
• Level 1 — Quoted prices in active markets for identical assets or liabilities.
• Level 2 — Observable inputs other than quoted prices included in Level 1. We value assets and liabilities included in this
level using dealer and broker quotations, certain pricing models, bid prices, quoted prices for similar assets and liabilities in
active markets, or other inputs that are observable or can be corroborated by observable market data.
• Level 3 — Unobservable inputs that are supported by little or no market activity and that are significant to the fair value
of the assets or liabilities. This includes certain pricing models, discounted cash flow methodologies and similar techniques
that use significant unobservable inputs.
Recurring Fair Value Measurements
In accordance with accounting principles generally accepted in the United States, certain assets and liabilities are required to be
recorded at fair value on a recurring basis. For our Company, the only assets and liabilities that are adjusted to fair value on a
recurring basis are investments in equity and debt securities classified as trading or available-for-sale and derivative instruments.
129