Coca Cola 2011 Annual Report Download - page 114
Download and view the complete annual report
Please find page 114 of the 2011 Coca Cola annual report below. You can navigate through the pages in the report by either clicking on the pages listed below, or by using the keyword search tool below to find specific information within the annual report.-
 1
1 -
2
-
3
-
4
-
5
-
6
-
7
-
8
-
9
-
10
-
11
-
12
-
13
-
14
-
15
-
16
-
17
-
18
-
19
-
20
-
21
-
22
-
23
-
24
-
25
-
26
-
27
-
28
-
29
-
30
-
31
-
32
-
33
-
34
-
35
-
36
-
37
-
38
-
39
-
40
-
41
-
42
-
43
-
44
-
45
-
46
-
47
-
48
-
49
-
50
-
51
-
52
-
53
-
54
-
55
-
56
-
57
-
58
-
59
-
60
-
61
-
62
-
63
-
64
-
65
-
66
-
67
-
68
-
69
-
70
-
71
-
72
-
73
-
74
-
75
-
76
-
77
-
78
-
79
-
80
-
81
-
82
-
83
-
84
-
85
-
86
-
87
-
88
-
89
-
90
-
91
-
92
-
93
-
94
-
95
-
96
-
97
-
98
-
99
-
100
-
101
-
102
-
103
-
 104
104 -
 105
105 -
 106
106 -
 107
107 -
 108
108 -
 109
109 -
 110
110 -
 111
111 -
 112
112 -
 113
113 -
 114
114 -
 115
115 -
 116
116 -
 117
117 -
 118
118 -
 119
119 -
 120
120 -
 121
121 -
 122
122 -
 123
123 -
 124
124 -
125
-
126
-
127
-
128
-
129
-
130
-
131
-
132
-
133
-
134
-
135
-
136
-
137
-
138
-
139
-
140
-
141
-
142
-
143
-
144
-
145
-
146
-
147
-
148
-
149
-
150
-
151
-
152
-
153
-
154
-
155
-
156
-
157
-
158
-
159
-
160
-
161
-
162
-
163
-
164
-
165
-
166
 |
 |

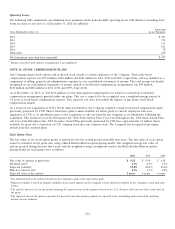
Operating Leases
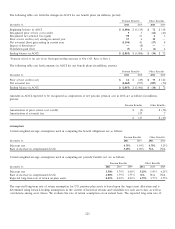
The following table summarizes our minimum lease payments under noncancelable operating leases with initial or remaining lease
terms in excess of one year as of December 31, 2011 (in millions):
Operating
Years Ending December 31, Lease Payments
2012 $ 241
2013 174
2014 133
2015 101
2016 78
Thereafter 270
Total minimum operating lease payments1$ 997
1Income associated with sublease arrangements is not significant.
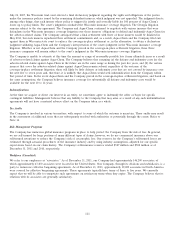
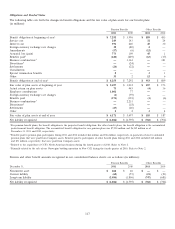
NOTE 12: STOCK COMPENSATION PLANS
Our Company grants stock options and restricted stock awards to certain employees of the Company. Total stock-based
compensation expense was $354 million, $380 million and $241 million in 2011, 2010 and 2009, respectively, and was included as a
component of selling, general and administrative expenses in our consolidated statements of income. The total income tax benefit
recognized in our consolidated statements of income related to stock-based compensation arrangements was $99 million,
$110 million and $68 million in 2011, 2010 and 2009, respectively.
As of December 31, 2011, we had $516 million of total unrecognized compensation cost related to nonvested stock-based
compensation arrangements granted under our plans. This cost is expected to be recognized over a weighted-average period of
1.8 years as stock-based compensation expense. This expected cost does not include the impact of any future stock-based
compensation awards.
As a result of our acquisition of CCE’s North American business, the Company assumed certain stock-based compensation plans
previously sponsored by CCE. Shares from these plans remain available for future grant to current employees who were
employees of CCE or its subsidiaries prior to the acquisition or who are hired by the Company or its subsidiaries following the
acquisition. The assumed Coca-Cola Enterprises Inc. 2001 Stock Option Plan, Coca-Cola Enterprises Inc. 2004 Stock Award Plan
and Coca-Cola Enterprises Inc. 2007 Incentive Award Plan previously sponsored by CCE have approximately 14 million shares
available for grant after conversion of CCE common stock into our common stock. The Company has not granted any equity
awards from the assumed plans.
Stock Option Plans
The fair value of our stock option grants is amortized over the vesting period, generally four years. The fair value of each option
award is estimated on the grant date using a Black-Scholes-Merton option-pricing model. The weighted-average fair value of
options granted during the past three years and the weighted-average assumptions used in the Black-Scholes-Merton option-
pricing model for such grants were as follows:
2011 2010 2009
Fair value of options at grant date $ 9.28 $ 9.39 $ 6.38
Dividend yield12.7% 2.9% 3.4%
Expected volatility219.0% 20.0% 20.0%
Risk-free interest rate32.3% 3.0% 2.8%
Expected term of the option45 years 6 years 6 years
1The dividend yield is the calculated yield on the Company’s stock at the time of the grant.
2Expected volatility is based on implied volatilities from traded options on the Company’s stock, historical volatility of the Company’s stock and other
factors.
3The risk-free interest rate for the period matching the expected term of the option is based on the U.S. Treasury yield curve in effect at the time of
the grant.
4The expected term of the option represents the period of time that options granted are expected to be outstanding and is derived by analyzing
historic exercise behavior.
112