Coca Cola 2011 Annual Report Download - page 54
Download and view the complete annual report
Please find page 54 of the 2011 Coca Cola annual report below. You can navigate through the pages in the report by either clicking on the pages listed below, or by using the keyword search tool below to find specific information within the annual report.-
 1
1 -
2
-
3
-
4
-
5
-
6
-
7
-
8
-
9
-
10
-
11
-
12
-
13
-
14
-
15
-
16
-
17
-
18
-
19
-
20
-
21
-
22
-
23
-
24
-
25
-
26
-
27
-
28
-
29
-
30
-
31
-
32
-
33
-
34
-
35
-
36
-
37
-
38
-
39
-
40
-
41
-
42
-
43
-
 44
44 -
 45
45 -
 46
46 -
 47
47 -
 48
48 -
 49
49 -
 50
50 -
 51
51 -
 52
52 -
 53
53 -
 54
54 -
 55
55 -
 56
56 -
 57
57 -
 58
58 -
 59
59 -
 60
60 -
 61
61 -
 62
62 -
 63
63 -
 64
64 -
65
-
66
-
67
-
68
-
69
-
70
-
71
-
72
-
73
-
74
-
75
-
76
-
77
-
78
-
79
-
80
-
81
-
82
-
83
-
84
-
85
-
86
-
87
-
88
-
89
-
90
-
91
-
92
-
93
-
94
-
95
-
96
-
97
-
98
-
99
-
100
-
101
-
102
-
103
-
104
-
105
-
106
-
107
-
108
-
109
-
110
-
111
-
112
-
113
-
114
-
115
-
116
-
117
-
118
-
119
-
120
-
121
-
122
-
123
-
124
-
125
-
126
-
127
-
128
-
129
-
130
-
131
-
132
-
133
-
134
-
135
-
136
-
137
-
138
-
139
-
140
-
141
-
142
-
143
-
144
-
145
-
146
-
147
-
148
-
149
-
150
-
151
-
152
-
153
-
154
-
155
-
156
-
157
-
158
-
159
-
160
-
161
-
162
-
163
-
164
-
165
-
166
 |
 |

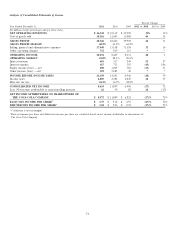
Net Operating Revenues
Year Ended December 31, 2011, versus Year Ended December 31, 2010
The Company’s net operating revenues increased $11,423 million, or 33 percent.
Net operating revenues for the North America operating segment increased $9,366 million, or 84 percent. This increase primarily
reflects the impact of structural changes related to the acquisition of CCE’s North American operations in addition to the impact
of our new license agreements with DPS. Net operating revenues for the North America operating segment also included a
1 percent increase in pricing to retailers, driven by a 2 percent increase in pricing on sparkling beverages, and a 1 percent
favorable impact due to foreign currency exchange fluctuations.
The following table illustrates, on a percentage basis, the estimated impact of key factors resulting in the increase (decrease) in
net operating revenues for each of our international and Bottling Investments operating segments:
Percent Change 2011 vs. 2010
Structural Price, Product & Currency
Volume2Changes Geographic Mix Fluctuations Total
International (including Bottling Investments)15% (3)% 2% 4% 8%
Eurasia & Africa 5% —% 7% (1)% 11%
Europe 1 — — 3 4
Latin America 5 (2) 7 4 14
Pacific 6 — (2) 7 11
Bottling Investments 4 (8) 3 4 3
1Represents the total change in net operating revenues for Bottling Investments and each of our geographic operating segments, excluding North
America.
2Represents the percent change in net operating revenues attributable to the increase (decrease) in concentrate sales volume for our geographic
operating segments (expressed in equivalent unit cases). For our Bottling Investments operating segment, this represents the percent change in net
operating revenues attributable to the increase (decrease) in unit case volume for the Bottling Investments operating segment after considering the
impact of structural changes. Our Bottling Investments operating segment data reflects unit case volume growth for consolidated bottlers only. Refer
to the heading ‘‘Beverage Volume’’ above.
Refer to the heading ‘‘Beverage Volume’’ above for additional information related to changes in our unit case and concentrate
sales volume.
The structural change in the Bottling Investments operating segment was primarily related to the sale of all our ownership
interests in our Norwegian and Swedish bottling operations to New CCE on October 2, 2010. Refer to the heading ‘‘Structural
Changes, Acquired Brands and New License Agreements’’ above. The structural change in the Latin America operating segment
was related to the sale of 50 percent of our investment in Le˜
ao Junior, S.A. (‘‘Le˜
ao Junior’’) during the third quarter of 2010.
Price, product and geographic mix had a favorable 2 percent impact on our international and Bottling Investments net operating
revenues. Price, product and geographic mix for our operating segments was impacted by a variety of factors and events including,
but not limited to, the following:
• Our international and Bottling Investments operating segments’ results were unfavorably impacted by geographic mix as a
result of growth in our emerging and developing markets. The revenue per unit sold in these markets is generally less than
in developed markets;
• Eurasia and Africa was favorably impacted by price mix as a result of pricing increases in a number of key markets;
• Europe’s price mix was even, including a negative 1 percent impact as a result of a change in our concentrate pricing
strategy in Germany with our consolidated bottler;
• Latin America was favorably impacted by price mix as a result of pricing increases in a number of key markets. Also, still
beverages grew faster than sparkling beverages in Latin America, bolstered by the strong performance of Del Valle;
• Pacific was unfavorably impacted by geographic mix due to the growth in emerging and developing markets. The revenue
per unit sold in these markets is generally less than in developed markets;
• Pacific was unfavorably impacted by channel and product mix due to the earthquake and tsunami that devastated
52