Coca Cola 2011 Annual Report Download - page 107
Download and view the complete annual report
Please find page 107 of the 2011 Coca Cola annual report below. You can navigate through the pages in the report by either clicking on the pages listed below, or by using the keyword search tool below to find specific information within the annual report.-
 1
1 -
2
-
3
-
4
-
5
-
6
-
7
-
8
-
9
-
10
-
11
-
12
-
13
-
14
-
15
-
16
-
17
-
18
-
19
-
20
-
21
-
22
-
23
-
24
-
25
-
26
-
27
-
28
-
29
-
30
-
31
-
32
-
33
-
34
-
35
-
36
-
37
-
38
-
39
-
40
-
41
-
42
-
43
-
44
-
45
-
46
-
47
-
48
-
49
-
50
-
51
-
52
-
53
-
54
-
55
-
56
-
57
-
58
-
59
-
60
-
61
-
62
-
63
-
64
-
65
-
66
-
67
-
68
-
69
-
70
-
71
-
72
-
73
-
74
-
75
-
76
-
77
-
78
-
79
-
80
-
81
-
82
-
83
-
84
-
85
-
86
-
87
-
88
-
89
-
90
-
91
-
92
-
93
-
94
-
95
-
96
-
 97
97 -
 98
98 -
 99
99 -
 100
100 -
 101
101 -
 102
102 -
 103
103 -
 104
104 -
 105
105 -
 106
106 -
 107
107 -
 108
108 -
 109
109 -
 110
110 -
 111
111 -
 112
112 -
 113
113 -
 114
114 -
 115
115 -
 116
116 -
 117
117 -
118
-
119
-
120
-
121
-
122
-
123
-
124
-
125
-
126
-
127
-
128
-
129
-
130
-
131
-
132
-
133
-
134
-
135
-
136
-
137
-
138
-
139
-
140
-
141
-
142
-
143
-
144
-
145
-
146
-
147
-
148
-
149
-
150
-
151
-
152
-
153
-
154
-
155
-
156
-
157
-
158
-
159
-
160
-
161
-
162
-
163
-
164
-
165
-
166
 |
 |

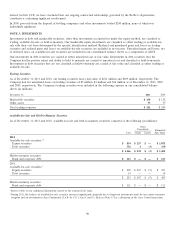
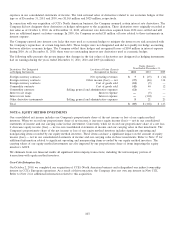
Other Equity Method Investments
Our other equity method investments include our ownership interests in Coca-Cola Hellenic, Coca-Cola FEMSA and Coca-Cola
Amatil. As of December 31, 2011, we owned approximately 23 percent, 29 percent and 29 percent, respectively, of these
companies’ common shares. As of December 31, 2011, our investment in our equity method investees in the aggregate exceeded
our proportionate share of the net assets of these equity method investees by $1,575 million. This difference is not amortized.
A summary of financial information for our equity method investees in the aggregate, other than CCE, is as follows (in millions):
Year Ended December 31, 2011 2010 2009
Net operating revenues $ 42,472 $ 38,663 $ 34,292
Cost of goods sold 26,271 23,053 20,205
Gross profit $ 16,201 $ 15,610 $ 14,087
Operating income $ 4,181 $ 4,134 $ 3,657
Consolidated net income $ 2,237 $ 2,659 $ 2,269
Less: Net income attributable to noncontrolling interests 99 89 78
Net income attributable to common shareowners $ 2,138 $ 2,570 $ 2,191
December 31, 2011 2010
Current assets $ 13,960 $ 12,223
Noncurrent assets 27,152 26,524
Total assets $ 41,112 $ 38,747
Current liabilities $ 10,545 $ 9,039
Noncurrent liabilities 11,646 11,175
Total liabilities $ 22,191 $ 20,214
Shareowners’ equity $ 18,392 $ 18,046
Noncontrolling interest 529 487
Total equity $ 18,921 $ 18,533
Company equity investment $ 7,234 $ 6,954
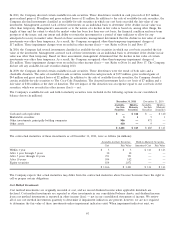
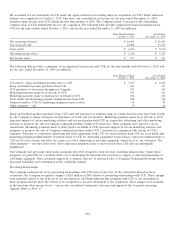
Net sales to equity method investees other than CCE, the majority of which are located outside the United States, were
$6.9 billion, $6.2 billion and $5.6 billion in 2011, 2010 and 2009, respectively. Total payments, primarily marketing, made to equity
method investees other than CCE were $1,147 million, $1,034 million and $878 million in 2011, 2010 and 2009, respectively. In
addition, purchases of finished products from equity method investees other than CCE were $430 million, $205 million and
$152 million in 2011, 2010 and 2009, respectively.
If valued at the December 31, 2011, quoted closing prices of shares actively traded on stock markets, the value of our equity
method investments in publicly traded bottlers would have exceeded our carrying value by $6.2 billion.
Net Receivables and Dividends from Equity Method Investees
Total net receivables due from equity method investees were $1,042 million and $899 million as of December 31, 2011 and 2010,
respectively. The total amount of dividends received from equity method investees was $421 million, $354 million and $422 million
for the years ended December 31, 2011, 2010 and 2009, respectively. Dividends received included a $60 million and $183 million
special dividend from Coca-Cola Hellenic during 2011 and 2009, respectively. We classified the receipt of these cash dividends in
cash flows from operating activities due to the fact that our cumulative equity in earnings from Coca-Cola Hellenic exceeded the
cumulative distributions received; therefore, the dividends were deemed to be a return on our investment and not a return of our
investment.
105