Coca Cola 2011 Annual Report Download - page 135
Download and view the complete annual report
Please find page 135 of the 2011 Coca Cola annual report below. You can navigate through the pages in the report by either clicking on the pages listed below, or by using the keyword search tool below to find specific information within the annual report.-
 1
1 -
2
-
3
-
4
-
5
-
6
-
7
-
8
-
9
-
10
-
11
-
12
-
13
-
14
-
15
-
16
-
17
-
18
-
19
-
20
-
21
-
22
-
23
-
24
-
25
-
26
-
27
-
28
-
29
-
30
-
31
-
32
-
33
-
34
-
35
-
36
-
37
-
38
-
39
-
40
-
41
-
42
-
43
-
44
-
45
-
46
-
47
-
48
-
49
-
50
-
51
-
52
-
53
-
54
-
55
-
56
-
57
-
58
-
59
-
60
-
61
-
62
-
63
-
64
-
65
-
66
-
67
-
68
-
69
-
70
-
71
-
72
-
73
-
74
-
75
-
76
-
77
-
78
-
79
-
80
-
81
-
82
-
83
-
84
-
85
-
86
-
87
-
88
-
89
-
90
-
91
-
92
-
93
-
94
-
95
-
96
-
97
-
98
-
99
-
100
-
101
-
102
-
103
-
104
-
105
-
106
-
107
-
108
-
109
-
110
-
111
-
112
-
113
-
114
-
115
-
116
-
117
-
118
-
119
-
120
-
121
-
122
-
123
-
124
-
 125
125 -
 126
126 -
 127
127 -
 128
128 -
 129
129 -
 130
130 -
 131
131 -
 132
132 -
 133
133 -
 134
134 -
 135
135 -
 136
136 -
 137
137 -
 138
138 -
 139
139 -
 140
140 -
 141
141 -
 142
142 -
 143
143 -
 144
144 -
 145
145 -
146
-
147
-
148
-
149
-
150
-
151
-
152
-
153
-
154
-
155
-
156
-
157
-
158
-
159
-
160
-
161
-
162
-
163
-
164
-
165
-
166
 |
 |

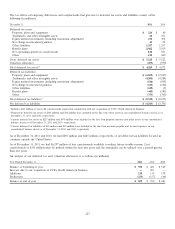
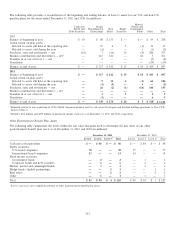
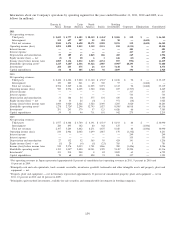
The following table provides a reconciliation of the beginning and ending balance of Level 3 assets for our U.S. and non-U.S.
pension plans for the years ended December 31, 2011 and 2010 (in millions):
Mutual,
Corporate Hedge Pooled and
Bonds and Funds/Limited Real Equity Commingled
Debt Securities Partnerships Estate Securities Funds Other Total
2010
Balance at beginning of year $ 10 $ 80 $ 153 $ — $ — $ 45 $ 288
Actual return on plan assets:
Related to assets still held at the reporting date — 19 4 5 (1) 10 37
Related to assets sold during the year — (3) — — 1 (1) (3)
Purchases, sales and settlements — net (10) 7 (36) 10 (4) 288 255
Business combinations and divestitures — net1— 213 121 — 24 5 363
Transfers in or out of Level 3 — net — 1 — — — (5) (4)
Translation — — — — — (39) (39)
Balance at end of year $ — $ 317 $ 242 $ 15 $ 20 $ 3032$ 897
2011
Balance at beginning of year $ — $ 317 $ 242 $ 15 $ 20 $ 303 $ 897
Actual return on plan assets:
Related to assets still held at the reporting date — 9 35 4 (5) 61 104
Related to assets sold during the year — (3) (5) — 6 — (2)
Purchases, sales and settlements — net — 26 (2) (1) (16) 146 153
Business combinations and divestitures — net ———————
Transfers in or out of Level 3 — net —1—2—25
Translation —(1)———65
Balance at end of year $ — $ 349 $ 270 $ 20 $ 5 $ 5182$ 1,162
1Primarily related to our acquisition of CCE’s North American business and the sale of our Norwegian and Swedish bottling operations to New CCE.
Refer to Note 2.
2Includes $514 million and $299 million of purchased annuity contracts as of December 31, 2011 and 2010, respectively.
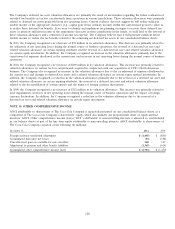
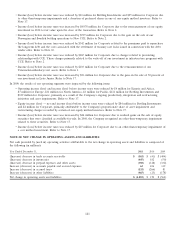
Other Postretirement Benefit Plan Assets
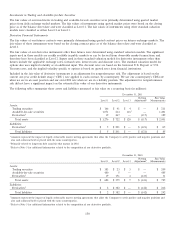
The following table summarizes the levels within the fair value hierarchy used to determine the fair value of our other
postretirement benefit plan assets as of December 31, 2011 and 2010 (in millions):
December 31, 2011 December 31, 2010
Level 1 Level 2 Level 31Total Level 1 Level 2 Level 31Total
Cash and cash equivalents $— $86 $— $ 86 $— $84 $— $ 84
Equity securities:
U.S.-based companies 70 — — 70 75——75
International-based companies 13 — — 13 14——14
Fixed-income securities:
Government bonds —2—2 —1—1
Corporate bonds and debt securities —6—6 —6—6
Mutual, pooled and commingled funds —3—3 —3—3
Hedge funds / limited partnerships —— 2 2 —— 1 1
Real estate —— 2 2 —— 2 2
Other —1—1 —1—1
Total $ 83 $ 98 $ 4 $ 185 $ 89 $ 95 $ 3 $ 187
1Level 3 assets are not a significant portion of other postretirement benefit plan assets.
133