Coca Cola 2011 Annual Report Download - page 87
Download and view the complete annual report
Please find page 87 of the 2011 Coca Cola annual report below. You can navigate through the pages in the report by either clicking on the pages listed below, or by using the keyword search tool below to find specific information within the annual report.-
 1
1 -
2
-
3
-
4
-
5
-
6
-
7
-
8
-
9
-
10
-
11
-
12
-
13
-
14
-
15
-
16
-
17
-
18
-
19
-
20
-
21
-
22
-
23
-
24
-
25
-
26
-
27
-
28
-
29
-
30
-
31
-
32
-
33
-
34
-
35
-
36
-
37
-
38
-
39
-
40
-
41
-
42
-
43
-
44
-
45
-
46
-
47
-
48
-
49
-
50
-
51
-
52
-
53
-
54
-
55
-
56
-
57
-
58
-
59
-
60
-
61
-
62
-
63
-
64
-
65
-
66
-
67
-
68
-
69
-
70
-
71
-
72
-
73
-
74
-
75
-
76
-
 77
77 -
 78
78 -
 79
79 -
 80
80 -
 81
81 -
 82
82 -
 83
83 -
 84
84 -
 85
85 -
 86
86 -
 87
87 -
 88
88 -
 89
89 -
 90
90 -
 91
91 -
 92
92 -
 93
93 -
 94
94 -
 95
95 -
 96
96 -
 97
97 -
98
-
99
-
100
-
101
-
102
-
103
-
104
-
105
-
106
-
107
-
108
-
109
-
110
-
111
-
112
-
113
-
114
-
115
-
116
-
117
-
118
-
119
-
120
-
121
-
122
-
123
-
124
-
125
-
126
-
127
-
128
-
129
-
130
-
131
-
132
-
133
-
134
-
135
-
136
-
137
-
138
-
139
-
140
-
141
-
142
-
143
-
144
-
145
-
146
-
147
-
148
-
149
-
150
-
151
-
152
-
153
-
154
-
155
-
156
-
157
-
158
-
159
-
160
-
161
-
162
-
163
-
164
-
165
-
166
 |
 |
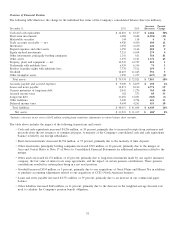
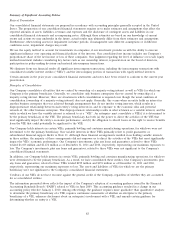
Deductions from Revenue
Our customers can earn certain incentives including, but not limited to, cash discounts, funds for promotional and marketing
activities, volume-based incentive programs and support for infrastructure programs. The costs associated with these incentives are
included in deductions from revenue, a component of net operating revenues in our consolidated statements of income. For
customer incentives that must be earned, management must make estimates related to the contractual terms, customer
performance and sales volume to determine the total amounts earned and to be recorded in deductions from revenue. In making
these estimates, management considers past results. The actual amounts ultimately paid may be different from our estimates.
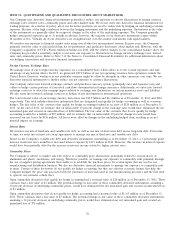
In some situations, the Company may determine it to be advantageous to make advance payments to specific customers to fund
certain marketing activities intended to generate profitable volume and/or invest in infrastructure programs with our bottlers that
are directed at strengthening our bottling system and increasing unit case volume. The Company also makes advance payments to
certain customers for distribution rights. The advance payments made to customers are initially capitalized and included in our
consolidated balance sheets in prepaid expenses and other assets and noncurrent other assets, depending on the duration of the
agreements. The assets are amortized over the applicable periods and included in deductions from revenue. The duration of these
agreements typically ranges from 4 to 10 years.
Amortization expense for infrastructure programs was $90 million, $137 million and $150 million in 2011, 2010 and 2009,
respectively. The aggregate deductions from revenue recorded by the Company in relation to these programs, including
amortization expense on infrastructure programs, were $5.8 billion, $5.0 billion and $4.5 billion in 2011, 2010 and 2009,
respectively.
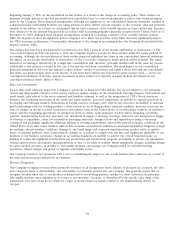
Advertising Costs
Our Company expenses production costs of print, radio, television and other advertisements as of the first date the advertisements
take place. All other marketing expenditures are expensed in the annual period in which the expenditure is incurred. Advertising
costs included in the line item selling, general and administrative expenses in our consolidated statements of income were
$3.3 billion, $2.9 billion and $2.8 billion in 2011, 2010 and 2009, respectively. As of December 31, 2011 and 2010, advertising and
production costs of $349 million and $305 million, respectively, were primarily recorded in the line item prepaid expenses and
other assets in our consolidated balance sheets.
For interim reporting purposes, we allocate our estimated full year marketing expenditures that benefit multiple interim periods to
each of our interim reporting periods. We use the proportion of each interim period’s actual unit case volume to the estimated
full year unit case volume as the basis for the allocation. This methodology results in our marketing expenditures being recognized
at a standard rate per unit case. At the end of each interim reporting period, we review our estimated full year unit case volume
and our estimated full year marketing expenditures in order to evaluate if a change in estimate is necessary. The impact of any
changes in these full year estimates is recognized in the interim period in which the change in estimate occurs. Our full year
marketing expenditures are not impacted by this interim accounting policy.
Shipping and Handling Costs
Shipping and handling costs related to the movement of finished goods from manufacturing locations to our sales distribution
centers are included in the line item cost of goods sold in our consolidated statements of income. Shipping and handling costs
incurred to move finished goods from our sales distribution centers to customer locations are included in the line item selling,
general and administrative expenses in our consolidated statements of income. As a result of our acquisition of CCE’s North
American business, the amount of shipping and handling costs recorded in the line item selling, general and administrative
expenses increased significantly and totaled $2.4 billion during the year ended December 31, 2011. Our customers do not pay us
separately for shipping and handling costs related to finished goods.
Net Income Per Share
Basic net income per share is computed by dividing net income by the weighted-average number of common shares outstanding
during the reporting period. Diluted net income per share is computed similarly to basic net income per share, except that it
includes the potential dilution that could occur if dilutive securities were exercised. Approximately 16 million, 38 million and
103 million stock option awards were excluded from the computations of diluted net income per share in 2011, 2010 and 2009,
respectively, because the awards would have been antidilutive for the years presented.
Cash Equivalents
We classify time deposits and other investments that are highly liquid and have maturities of three months or less at the date of
purchase as cash equivalents. We manage our exposure to counterparty credit risk through specific minimum credit standards,
diversification of counterparties and procedures to monitor our credit risk concentrations.
85