Coca Cola 2011 Annual Report Download - page 55
Download and view the complete annual report
Please find page 55 of the 2011 Coca Cola annual report below. You can navigate through the pages in the report by either clicking on the pages listed below, or by using the keyword search tool below to find specific information within the annual report.-
 1
1 -
2
-
3
-
4
-
5
-
6
-
7
-
8
-
9
-
10
-
11
-
12
-
13
-
14
-
15
-
16
-
17
-
18
-
19
-
20
-
21
-
22
-
23
-
24
-
25
-
26
-
27
-
28
-
29
-
30
-
31
-
32
-
33
-
34
-
35
-
36
-
37
-
38
-
39
-
40
-
41
-
42
-
43
-
44
-
 45
45 -
 46
46 -
 47
47 -
 48
48 -
 49
49 -
 50
50 -
 51
51 -
 52
52 -
 53
53 -
 54
54 -
 55
55 -
 56
56 -
 57
57 -
 58
58 -
 59
59 -
 60
60 -
 61
61 -
 62
62 -
 63
63 -
 64
64 -
 65
65 -
66
-
67
-
68
-
69
-
70
-
71
-
72
-
73
-
74
-
75
-
76
-
77
-
78
-
79
-
80
-
81
-
82
-
83
-
84
-
85
-
86
-
87
-
88
-
89
-
90
-
91
-
92
-
93
-
94
-
95
-
96
-
97
-
98
-
99
-
100
-
101
-
102
-
103
-
104
-
105
-
106
-
107
-
108
-
109
-
110
-
111
-
112
-
113
-
114
-
115
-
116
-
117
-
118
-
119
-
120
-
121
-
122
-
123
-
124
-
125
-
126
-
127
-
128
-
129
-
130
-
131
-
132
-
133
-
134
-
135
-
136
-
137
-
138
-
139
-
140
-
141
-
142
-
143
-
144
-
145
-
146
-
147
-
148
-
149
-
150
-
151
-
152
-
153
-
154
-
155
-
156
-
157
-
158
-
159
-
160
-
161
-
162
-
163
-
164
-
165
-
166
 |
 |

northern and eastern Japan on March 11, 2011; and
• Bottling Investments was favorably impacted by price mix as a result of pricing increases in a number of key markets,
including China, India and Latin America.
The favorable impact of foreign currency fluctuations increased net operating revenues for our international and Bottling
Investments operating segments by 4 percent. The favorable impact of changes in foreign currency exchange rates was primarily
due to a weaker U.S. dollar compared to certain other foreign currencies, including the euro, Japanese yen, Mexican peso,
Brazilian real, British pound, South African rand and Australian dollar, which had a favorable impact on the Eurasia and Africa,
Europe, Latin America, Pacific and Bottling Investments operating segments. Refer to the heading ‘‘Liquidity, Capital Resources
and Financial Position — Foreign Exchange.’’
Year Ended December 31, 2010, versus Year Ended December 31, 2009
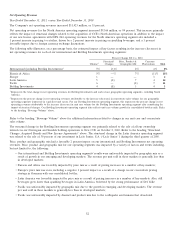
Net operating revenues increased $4,129 million, or 13 percent. The following table illustrates, on a percentage basis, the
estimated impact of key factors resulting in the increase (decrease) in net operating revenues by operating segment:
Percent Change 2010 vs. 2009
Structural Changes
Price, Product & Currency
Volume1Volume2Other Geographic Mix Fluctuations Total
Consolidated 5% —% 5% 1% 2% 13%
Eurasia & Africa 12% —% —% (2)% 6% 16%
Europe — — 2 1 (2) 1
Latin America 7 — (13) 9 3 6
North America 1 1 32 — 1 35
Pacific 6 — 1 (5) 6 8
Bottling Investments 10 (11) — (1) 2 —
Corporate * * * * * *
* Calculation is not meaningful.
1Represents the percent change in net operating revenues attributable to the increase (decrease) in concentrate sales volume for our geographic
operating segments, excluding the impact of volume associated with new license agreements (expressed in equivalent unit cases). For our Bottling
Investments operating segment, this represents the percent change in net operating revenues attributable to the increase (decrease) in unit case
volume for the Bottling Investments operating segment after considering the impact of structural changes. Our Bottling Investments operating
segment data reflects unit case volume growth for consolidated bottlers only. Refer to the heading ‘‘Beverage Volume’’ above.
2Represents the percent change in net operating revenues attributable to the increase (decrease) in concentrate sales volume related to new license
agreements for our geographic operating segments. For our Bottling Investments operating segment, this represents the percent change in net
operating revenues attributable to the increase (decrease) in unit case volume for the Bottling Investments operating segment due to structural
changes. Our Bottling Investments operating segment data reflects unit case volume growth for consolidated bottlers only. Refer to the heading
‘‘Beverage Volume’’ above.
Refer to the heading ‘‘Beverage Volume’’ above for additional information related to changes in our unit case and concentrate
sales volume.
Refer to the heading ‘‘Structural Changes, Acquired Brands and New License Agreements’’ above for additional information
related to significant structural changes. Although we do not normally consider new license agreements to be structural changes,
in the case of the DPS license agreements, given their correlation to our acquisition of CCE’s North American business, we have
included the impact of these license agreements as structural changes when explaining our 2010 financial results. Likewise, the
total revenues attributable to CCE’s North American business, including DPS, recognized by the Company during the three
months following the date of acquisition in 2010 are considered a structural change.
53