Coca Cola 2011 Annual Report Download - page 122
Download and view the complete annual report
Please find page 122 of the 2011 Coca Cola annual report below. You can navigate through the pages in the report by either clicking on the pages listed below, or by using the keyword search tool below to find specific information within the annual report.-
 1
1 -
2
-
3
-
4
-
5
-
6
-
7
-
8
-
9
-
10
-
11
-
12
-
13
-
14
-
15
-
16
-
17
-
18
-
19
-
20
-
21
-
22
-
23
-
24
-
25
-
26
-
27
-
28
-
29
-
30
-
31
-
32
-
33
-
34
-
35
-
36
-
37
-
38
-
39
-
40
-
41
-
42
-
43
-
44
-
45
-
46
-
47
-
48
-
49
-
50
-
51
-
52
-
53
-
54
-
55
-
56
-
57
-
58
-
59
-
60
-
61
-
62
-
63
-
64
-
65
-
66
-
67
-
68
-
69
-
70
-
71
-
72
-
73
-
74
-
75
-
76
-
77
-
78
-
79
-
80
-
81
-
82
-
83
-
84
-
85
-
86
-
87
-
88
-
89
-
90
-
91
-
92
-
93
-
94
-
95
-
96
-
97
-
98
-
99
-
100
-
101
-
102
-
103
-
104
-
105
-
106
-
107
-
108
-
109
-
110
-
111
-
 112
112 -
 113
113 -
 114
114 -
 115
115 -
 116
116 -
 117
117 -
 118
118 -
 119
119 -
 120
120 -
 121
121 -
 122
122 -
 123
123 -
 124
124 -
 125
125 -
 126
126 -
 127
127 -
 128
128 -
 129
129 -
 130
130 -
 131
131 -
 132
132 -
133
-
134
-
135
-
136
-
137
-
138
-
139
-
140
-
141
-
142
-
143
-
144
-
145
-
146
-
147
-
148
-
149
-
150
-
151
-
152
-
153
-
154
-
155
-
156
-
157
-
158
-
159
-
160
-
161
-
162
-
163
-
164
-
165
-
166
 |
 |

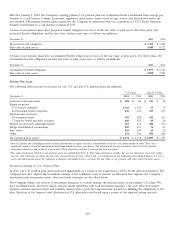
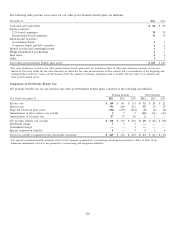
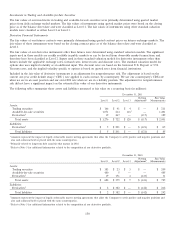
The following table presents total assets for our other postretirement benefit plans (in millions):
December 31, 2011 2010
Cash and cash equivalents $86 $84
Equity securities:
U.S.-based companies 70 75
International-based companies 13 14
Fixed-income securities:
Government bonds 21
Corporate bonds and debt securities 66
Mutual, pooled and commingled funds 33
Hedge funds/limited partnerships 21
Real estate 22
Other 11
Total other postretirement benefit plan assets1$ 185 $ 187
1Fair value disclosures related to our other postretirement benefit plan assets are included in Note 16. Fair value disclosures include, but are not
limited to, the levels within the fair value hierarchy on which the fair value measurements in their entirety fall, a reconciliation of the beginning and
ending balances of Level 3 assets and information about the valuation techniques and inputs used to measure the fair value of our pension and
other postretirement assets.
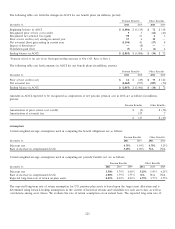
Components of Net Periodic Benefit Cost
Net periodic benefit cost for our pension and other postretirement benefit plans consisted of the following (in millions):
Pension Benefits Other Benefits
Year Ended December 31, 2011 2010 2009 2011 2010 2009
Service cost $ 249 $ 143 $ 113 $32 $24 $21
Interest cost 391 260 213 45 30 29
Expected return on plan assets (494) (295) (214) (8) (8) (8)
Amortization of prior service cost (credit) 555(61) (61) (61)
Amortization of actuarial loss 87 57 86 23—
Net periodic benefit cost (credit) $ 238 $ 170 $ 203 $10 $ (12) $ (19)
Settlement charge 365———
Curtailment charge ——1———
Special termination benefits18—9314
Total cost (credit) recognized in the statements of income $ 249 $ 176 $ 218 $13 $ (11) $ (15)
1The special termination benefits primarily relate to the Company’s productivity, restructuring and integration initiatives. Refer to Note 18 for
additional information related to our productivity, restructuring and integration initiatives.
120