Sony 2008 Annual Report Download - page 102
Download and view the complete annual report
Please find page 102 of the 2008 Sony annual report below. You can navigate through the pages in the report by either clicking on the pages listed below, or by using the keyword search tool below to find specific information within the annual report.-
 1
1 -
2
-
3
-
4
-
5
-
6
-
7
-
8
-
9
-
10
-
11
-
12
-
13
-
14
-
15
-
16
-
17
-
18
-
19
-
20
-
21
-
22
-
23
-
24
-
25
-
26
-
27
-
28
-
29
-
30
-
31
-
32
-
33
-
34
-
35
-
36
-
37
-
38
-
39
-
40
-
41
-
42
-
43
-
44
-
45
-
46
-
47
-
48
-
49
-
50
-
51
-
52
-
53
-
54
-
55
-
56
-
57
-
58
-
59
-
60
-
61
-
62
-
63
-
64
-
65
-
66
-
67
-
68
-
69
-
70
-
71
-
72
-
73
-
74
-
75
-
76
-
77
-
78
-
79
-
80
-
81
-
82
-
83
-
84
-
85
-
86
-
87
-
88
-
89
-
90
-
91
-
 92
92 -
 93
93 -
 94
94 -
 95
95 -
 96
96 -
 97
97 -
 98
98 -
 99
99 -
 100
100 -
 101
101 -
 102
102 -
 103
103 -
 104
104 -
 105
105 -
 106
106
 |
 |

100
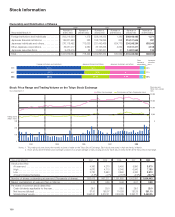
Stock Price Range and Trading Volume on the Tokyo Stock Exchange
Years ended March 31
20052004 2006 2007 2008
300
200
100
0
20,000
15,000
10,000
5,000
0
Notes: 1. This trading volume shows the monthly volume of trade on the Tokyo Stock Exchange. Each fiscal year starts in April and ends in March.
2. Stock prices and the Nikkei stock average is based on a simple average of daily closing prices for each day of every month at the Tokyo Stock Exchange.
Trading volume
(Million shares)
Stock price and
Nikkei stock average
(Yen)
Nikkei stock average Closing price of Sony Corporation stock
Ownership and Distribution of Shares
2006 2007 2008
Number of Number of Number of Number of Number of Number of
Years ended March 31 shares held shareholders shares held shareholders shares held shareholders
Foreign institutions and individuals .........
502,219,220 1,375 528,218,332 1,380 508,166,485 1,371
Japanese financial institutions ............
184,831,560 293 198,775,896 269 216,107,606 297
Japanese individuals and others ...........
270,118,452 712,033 231,442,469 624,770 234,246,294 633,045
Other Japanese corporations .............
35,031,017 4,650 33,163,266 4,054 31,101,417 4,108
Japanese securities firms ................
9,479,415 98 11,297,301 81 14,821,562 124
Total ................................
1,001,679,664 718,449 1,002,897,264 630,554 1,004,443,364 638,945
Stock Information
Years ended March 31 2004 2005 2006 2007 2008
Stock price (Yen)
At year-end ...........................................
4,360 4,270 5,450 5,990 3,970
High ................................................
4,670 4,710 6,040 6,540 7,190
Low ................................................
2,720 3,550 3,660 4,340 3,910
Annual increase/decrease ................................
+3.8% –2.1% +27.6% +9.9% –33.7%
Number of shares outstanding at year-end (Thousands of shares) ...
926,418 997,211 1,001,680 1,002,897 1,004,443
Market capitalization at year-end (Yen in trillions). . . . . . . . . . . . . . . . .
4.04 4.26 5.46 6.01 3.99
Per share of common stock data (Yen)
Cash dividends applicable to the year .......................
25.0 25.0 25.0 25.0 25.0
Net Income (diluted) ....................................
87.00 158.07 116.88 120.29 351.10
Stockholders’ equity ....................................
2,563.67 2,872.21 3,200.85 3,363.77 3,453.25
2006
2007
2008
52.7% 19.8% 23.1% 3.3%
50.1% 18.5% 27.0% 3.5%
1.1%
50.6% 21.5% 23.3% 3.1% 1.5%
0.9%
Japanese individuals and othersJapanese financial institutionsForeign institutions and individuals
Other
Japanese
corporations
Japanese
securities
firms