Sony 2008 Annual Report Download - page 99
Download and view the complete annual report
Please find page 99 of the 2008 Sony annual report below. You can navigate through the pages in the report by either clicking on the pages listed below, or by using the keyword search tool below to find specific information within the annual report.-
 1
1 -
2
-
3
-
4
-
5
-
6
-
7
-
8
-
9
-
10
-
11
-
12
-
13
-
14
-
15
-
16
-
17
-
18
-
19
-
20
-
21
-
22
-
23
-
24
-
25
-
26
-
27
-
28
-
29
-
30
-
31
-
32
-
33
-
34
-
35
-
36
-
37
-
38
-
39
-
40
-
41
-
42
-
43
-
44
-
45
-
46
-
47
-
48
-
49
-
50
-
51
-
52
-
53
-
54
-
55
-
56
-
57
-
58
-
59
-
60
-
61
-
62
-
63
-
64
-
65
-
66
-
67
-
68
-
69
-
70
-
71
-
72
-
73
-
74
-
75
-
76
-
77
-
78
-
79
-
80
-
81
-
82
-
83
-
84
-
85
-
86
-
87
-
88
-
 89
89 -
 90
90 -
 91
91 -
 92
92 -
 93
93 -
 94
94 -
 95
95 -
 96
96 -
 97
97 -
 98
98 -
 99
99 -
 100
100 -
 101
101 -
 102
102 -
 103
103 -
 104
104 -
 105
105 -
 106
106
 |
 |
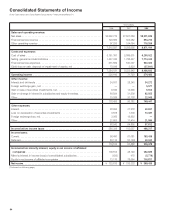
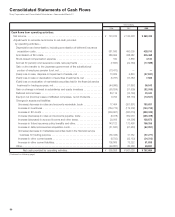
97
Yen in millions
2006 2007 2008
Cash flows from investing activities:
Payments for purchases of fixed assets .................................
¥ (462,473) ¥(527,515) ¥ (474,552)
Proceeds from sales of fixed assets . . . . . . . . . . . . . . . . . . . . . . . . . . . . . . . . . . .
38,168 87,319 144,741
Payments for investments and advances by financial service business .........
(1,368,158) (914,754) (2,283,491)
Payments for investments and advances (other than financial service business) ...
(36,947) (100,152) (103,082)
Proceeds from maturities of marketable securities, sales of securities
investments and collections of advances by financial service business ..........
857,376 679,772 1,441,496
Proceeds from maturities of marketable securities, sales of securities
investments and collections of advances (other than financial service business) ...
24,527 22,828 51,947
Proceeds from sales of subsidiaries’ and equity investees’ stocks .............
75,897 43,157 307,133
Other ..........................................................
346 (6,085) 5,366
Net cash used in investing activities .............................
(871,264) (715,430) (910,442)
Cash flows from financing activities:
Proceeds from issuance of long-term debt . . . . . . . . . . . . . . . . . . . . . . . . . . . . . .
246,326 270,780 31,093
Payments of long-term debt .........................................
(138,773) (182,374) (34,701)
Increase (decrease) in short-term borrowings, net .........................
(11,045) 6,096 15,838
Increase in deposits from customers in the financial service business, net .......
190,320 273,435 485,965
Increase (decrease) in call money and bills sold in the banking business, net . . . .
86,100 (100,700) —
Dividends paid ...................................................
(24,810) (25,052) (25,098)
Proceeds from issuance of shares under stock-based compensation plans .....
4,681 5,566 7,484
Proceeds from issuance of shares by subsidiaries .........................
6,937 2,217 28,943
Other .........................................................
128 (2,065) (4,006)
Net cash provided by financing activities .........................
359,864 247,903 505,518
Effect of exchange rate changes on cash and cash equivalents . . . . . . . . . . . . . . . .
35,537 3,300 (66,228)
Net increase (decrease) in cash and cash equivalents . . . . . . . . . . . . . . . . . . . . . . .
(76,005) 96,801 286,532
Cash and cash equivalents at beginning of the fiscal year . . . . . . . . . . . . . . . . . . . .
779,103 703,098 799,899
Cash and cash equivalents at end of the fiscal year . . . . . . . . . . . . . . . . . . . . . . . . .
¥ 703,098 ¥ 799,899 ¥ 1,086,431
Supplemental data:
Cash paid during the fiscal year for—
Income taxes ....................................................
¥ 70,019 ¥ 104,822 ¥ 126,339
Interest ........................................................
24,651 23,000 18,817
Non-cash investing and financing activities—
Obtaining assets by entering into capital lease . . . . . . . . . . . . . . . . . . . . . . . . . . .
¥ 19,682 ¥ 13,784 ¥ 7,017