Sony 2008 Annual Report Download - page 71
Download and view the complete annual report
Please find page 71 of the 2008 Sony annual report below. You can navigate through the pages in the report by either clicking on the pages listed below, or by using the keyword search tool below to find specific information within the annual report.-
 1
1 -
2
-
3
-
4
-
5
-
6
-
7
-
8
-
9
-
10
-
11
-
12
-
13
-
14
-
15
-
16
-
17
-
18
-
19
-
20
-
21
-
22
-
23
-
24
-
25
-
26
-
27
-
28
-
29
-
30
-
31
-
32
-
33
-
34
-
35
-
36
-
37
-
38
-
39
-
40
-
41
-
42
-
43
-
44
-
45
-
46
-
47
-
48
-
49
-
50
-
51
-
52
-
53
-
54
-
55
-
56
-
57
-
58
-
59
-
60
-
 61
61 -
 62
62 -
 63
63 -
 64
64 -
 65
65 -
 66
66 -
 67
67 -
 68
68 -
 69
69 -
 70
70 -
 71
71 -
 72
72 -
 73
73 -
 74
74 -
 75
75 -
 76
76 -
 77
77 -
 78
78 -
 79
79 -
 80
80 -
 81
81 -
82
-
83
-
84
-
85
-
86
-
87
-
88
-
89
-
90
-
91
-
92
-
93
-
94
-
95
-
96
-
97
-
98
-
99
-
100
-
101
-
102
-
103
-
104
-
105
-
106
 |
 |

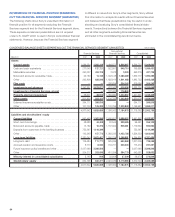
69
CASH FLOWS
Operating Activities: During the fiscal year ended March 31,
2008, Sony generated 757.7 billion yen of net cash from
operating activities, an increase of 196.7 billion yen, or 35.1
percent compared with the previous fiscal year. Of this total, all
segments excluding the Financial Services segment generated
519.1 billion yen of net cash from operating activities, an
increase of 213.5 billion yen, or 69.9 percent, compared with
the previous fiscal year, and the Financial Services segment
generated 242.6 billion yen of net cash from operating activities,
a decrease of 13.9 billion yen, or 5.4 percent, compared with
the previous fiscal year.
During the fiscal year, a variety of factors had a positive impact
on operating cash flow, including the contribution of net income
from the Electronics segment, after taking into account depre-
ciation and amortization, and an increase in insurance premium
revenue reflecting a steady increase in insurance-in-force at
Sony Life. Partially offsetting these contributions was an increase
in inventory, primarily within the Electronics segment.
Compared with the previous fiscal year, net cash provided by
operating activities increased during the fiscal year mainly as a
result of the increase in net income after taking into account
depreciation and amortization.
Investing Activities: During the fiscal year, Sony used 910.4
billion yen of net cash in investing activities, an increase of 195.0
billion yen, or 27.3 percent, compared with the previous fiscal
year. Of this total, all segments, excluding the Financial Services
segment, used 14.9 billion yen of net cash in investing activities,
a decrease of 416.2 billion yen, or 96.5 percent, compared with
the previous fiscal year. The Financial Services segment used
873.6 billion yen in net cash, an increase of 596.9 billion yen, or
215.7 percent compared with the previous fiscal year.
During the fiscal year, semiconductor fabrication equipment
was purchased and Sony/ATV acquired Famous Music, a
U.S.-based music publishing company. Partially offsetting these
uses of net cash were proceeds from the sale of a portion of
SFH shares, the sale of “The Sony Center am Potsdamer Platz”
in Berlin and the sale of a portion of the site of Sony’s former
headquarters. Within the Financial Services segment, payments
for investments and advances, carried out primarily at Sony Life,
and at Sony Bank where operations are expanding, exceeded
proceeds from the maturities of marketable securities, sales of
securities investments and collections of advances.
Compared with the previous fiscal year, net cash used in
investing activities decreased significantly within all segments
excluding the Financial Services segment, primarily due to the
sale of a portion of SFH shares. On the other hand, net cash
used in investing activities within the Financial Services segment
increased significantly compared to the previous fiscal year
primarily because the increase in payments for investments and
advances, carried out primarily at Sony Life and Sony Bank,
exceeded the increase in proceeds from the maturities of
marketable securities, sales of securities investments and
collections of advances compared with the previous fiscal year.
In all segments excluding the Financial Services segment, net
cash provided by operating and investing activities combined
was 504.2 billion yen, an increase of 629.7 billion yen as
compared to net cash used of 125.5 billion yen in the previous
fiscal year.
Financing Activities: During the fiscal year ended March 31,
2008, 505.5 billion yen of net cash was provided by financing
activities. Of the total, 12.1 billion yen of net cash was used in
financing activities within all segments excluding the Financial
Services segment, a decrease of 71.7 billion yen compared to
the 59.6 billion yen in net cash generated by financing activities
in the previous fiscal year. This was primarily due to the fact that
straight bonds were redeemed during the fiscal year.
In the Financial Services segment, as a result of an increase in
policyholder accounts at Sony Life and an increase in deposits
from customers in the banking business, financing activities
generated 491.7 billion yen of net cash.
Accounting for all these factors and the effect of exchange
rate changes, the total outstanding balance of cash and cash
equivalents at the end of the fiscal year increased by 286.5
billion yen, or 35.8 percent, to 1,086.4 billion yen, compared
with the end of the previous fiscal year. The total outstanding
balance of cash and cash equivalents of all segments, excluding
the Financial Services segment, increased by 425.9 billion yen,
or 81.4 percent, to 948.7 billion yen, and for the Financial
Services segment, decreased by 139.3 billion yen, or 50.3
percent, to 137.7 billion yen, compared with the end of the
previous fiscal year.
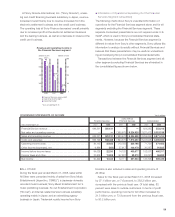
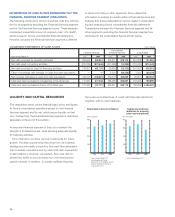
(Yen in billions)
Cash flows
■¥Cash flows from operating activities
■¥Cash flows from investing activities
■¥Cash flows from financing activities
* Years ended March 31
1,000
500
0
–500
–1,000 2006 2007 2008