Sony 2008 Annual Report Download - page 90
Download and view the complete annual report
Please find page 90 of the 2008 Sony annual report below. You can navigate through the pages in the report by either clicking on the pages listed below, or by using the keyword search tool below to find specific information within the annual report.-
 1
1 -
2
-
3
-
4
-
5
-
6
-
7
-
8
-
9
-
10
-
11
-
12
-
13
-
14
-
15
-
16
-
17
-
18
-
19
-
20
-
21
-
22
-
23
-
24
-
25
-
26
-
27
-
28
-
29
-
30
-
31
-
32
-
33
-
34
-
35
-
36
-
37
-
38
-
39
-
40
-
41
-
42
-
43
-
44
-
45
-
46
-
47
-
48
-
49
-
50
-
51
-
52
-
53
-
54
-
55
-
56
-
57
-
58
-
59
-
60
-
61
-
62
-
63
-
64
-
65
-
66
-
67
-
68
-
69
-
70
-
71
-
72
-
73
-
74
-
75
-
76
-
77
-
78
-
79
-
 80
80 -
 81
81 -
 82
82 -
 83
83 -
 84
84 -
 85
85 -
 86
86 -
 87
87 -
 88
88 -
 89
89 -
 90
90 -
 91
91 -
 92
92 -
 93
93 -
 94
94 -
 95
95 -
 96
96 -
 97
97 -
 98
98 -
 99
99 -
 100
100 -
101
-
102
-
103
-
104
-
105
-
106
 |
 |

88
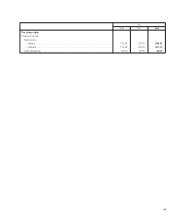
Five-Year Summary of Selected Financial Data
Sony Corporation and Consolidated Subsidiaries—Years ended March 31
Yen in millions
(Yen per share amounts)
2004 2005 2006 2007 2008
FOR THE YEAR
Sales and operating revenue . . . . . . . . . . . . . . . . .
¥7,530,635 ¥7,191,325 ¥ 7,510,597 ¥ 8,295,695 ¥ 8,871,414
Operating income ..........................
133,146 145,628 226,416 71,750 374,482
Income before income taxes . . . . . . . . . . . . . . . . .
144,067 157,207 286,329 102,037 466,317
Income taxes .............................
52,774 16,044 176,515 53,888 203,478
Equity in net income of affiliated companies ........
1,714 29,039 13,176 78,654 100,817
Net income ..............................
88,511 163,838 123,616 126,328 369,435
Per share data:
Common stock
Net income
—Basic ............................
¥ 95.97 ¥ 175.90 ¥ 122.58 ¥ 126.15 ¥ 368.33
—Diluted ...........................
87.00 158.07 116.88 120.29 351.10
Cash dividends ........................
25.00 25.00 25.00 25.00 25.00
Number of weighted-average shares for basic
per share data (thousands of shares) .......
923,650 931,125 997,781 1,001,403 1,003,001
Subsidiary tracking stock
Net income (loss)
—Basic ............................
(41.80) 17.21 — — —
Number of weighted-average shares for basic
per share data (thousands of shares) .......
3,072 3,072 — — —
Depreciation and amortization* ................
¥ 366,269 ¥ 372,865 ¥ 381,843 ¥ 400,009 ¥ 428,010
Capital expenditures (additions to property,
plant and equipment) . . . . . . . . . . . . . . . . . . . . . .
378,264 356,818 384,347 414,138 335,726
Research and development expenses . . . . . . . . . .
514,483 502,008 531,795 543,937 520,568
AT YEAR-END
Net working capital .........................
¥ 381,140 ¥ 746,803 ¥ 569,296 ¥ 994,871 ¥ 986,296
Stockholders’ equity ........................
2,378,002 2,870,338 3,203,852 3,370,704 3,465,089
Stockholders’ equity per share attributable to
common stock ...........................
¥ 2,563.67 ¥ 2,872.21 ¥ 3,200.85 ¥ 3,363.77 ¥ 3,453.25
Total assets ..............................
¥9,090,662 ¥9,499,100 ¥10,607,753 ¥11,716,362 ¥12,552,739
Number of shares issued at year-end
(thousands of shares):
Common stock ..........................
926,418 997,211 1,001,680 1,002,897 1,004,443
Subsidiary tracking stock . . . . . . . . . . . . . . . . . .
3,072 3,072
— — —
* Including amortization expenses for intangible assets and for deferred insurance acquisition costs
Note: Effective April 1, 2006, Sony reclassified royalty income as a component of sales and operating revenue, rather than as a component of other income as previously
recorded. In connection with this reclassification, sales and operating revenue, operating income and other income for the fiscal years ended March 31, 2004, 2005
and 2006 have been reclassified to conform with the presentation of these items for the fiscal year ended March 31, 2007. The amounts of royalty income
reclassified from other income to sales and operating revenue for the fiscal years ended March 31, 2004, 2005 and 2006 were 34,244, 31,709, and 35,161 million
yen, respectively. In addition to the above, certain reclassifications of the financial statements for the fiscal years ended March 31, 2004, 2005 and 2006 have been
made to conform to the presentation for the fiscal year ended March 31, 2007.