Sony 2008 Annual Report Download - page 61
Download and view the complete annual report
Please find page 61 of the 2008 Sony annual report below. You can navigate through the pages in the report by either clicking on the pages listed below, or by using the keyword search tool below to find specific information within the annual report.-
 1
1 -
2
-
3
-
4
-
5
-
6
-
7
-
8
-
9
-
10
-
11
-
12
-
13
-
14
-
15
-
16
-
17
-
18
-
19
-
20
-
21
-
22
-
23
-
24
-
25
-
26
-
27
-
28
-
29
-
30
-
31
-
32
-
33
-
34
-
35
-
36
-
37
-
38
-
39
-
40
-
41
-
42
-
43
-
44
-
45
-
46
-
47
-
48
-
49
-
50
-
 51
51 -
 52
52 -
 53
53 -
 54
54 -
 55
55 -
 56
56 -
 57
57 -
 58
58 -
 59
59 -
 60
60 -
 61
61 -
 62
62 -
 63
63 -
 64
64 -
 65
65 -
 66
66 -
 67
67 -
 68
68 -
 69
69 -
 70
70 -
 71
71 -
72
-
73
-
74
-
75
-
76
-
77
-
78
-
79
-
80
-
81
-
82
-
83
-
84
-
85
-
86
-
87
-
88
-
89
-
90
-
91
-
92
-
93
-
94
-
95
-
96
-
97
-
98
-
99
-
100
-
101
-
102
-
103
-
104
-
105
-
106
 |
 |
59
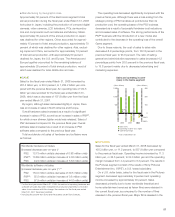
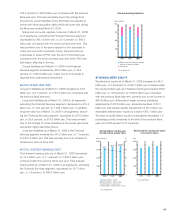
At Sony Finance International, Inc. (“Sony Finance”), a leas-
ing and credit financing business subsidiary in Japan, revenue
increased overall mainly due to revenue increases from the
electronic settlement business and the credit card business.
The operating loss at Sony Finance decreased overall primarily
due to increased profit at the electronic settlement business
and the leasing business, as well as a decrease in losses at the
credit card business.
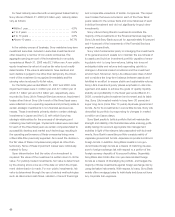
(Billions of yen) (Billions of yen)
Revenue and operating income in
the Financial Services segment
■¥Financial Services revenue (left)
■¥Operating income (right)
●¥Operating margin
* Years ended March 31
800
600
400
200
0
240
180
120
60
0
2006 2007 2008
25.3%
13.0%
3.9%
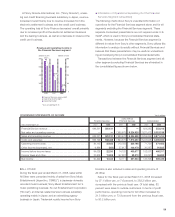
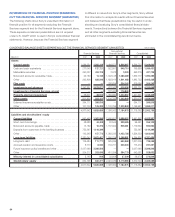
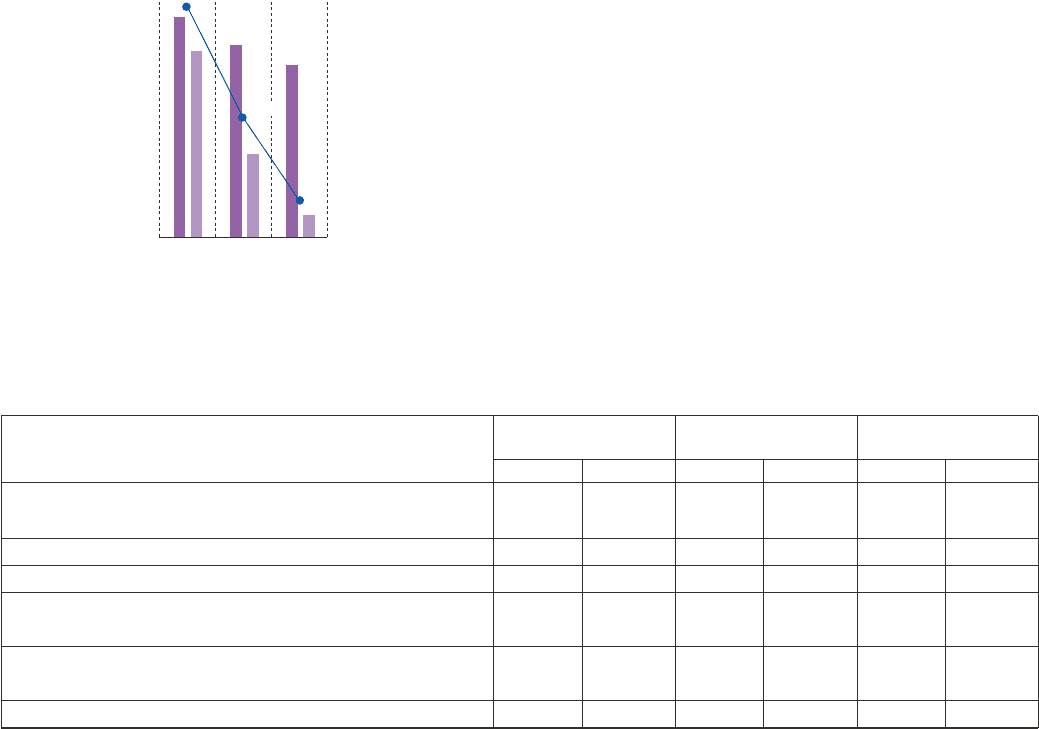
CONDENSED STATEMENTS OF INCOME
Yen in millions
Sony without
Financial Services Financial Services Consolidated
Years ended March 31 2007 2008 2007 2008 2007 2008
Financial Service revenue ...............................
649,341 581,121 — — 624,282 553,216
Net sales and operating revenue .........................
— — 7,680,578 8,324,828 7,671,413 8,318,198
Sales and operating revenue ............................
649,341 581,121 7,680,578 8,324,828 8,295,695 8,871,414
Costs and expenses ..................................
565,199 558,488 7,694,375 7,974,630 8,223,945 8,496,932
Operating income (loss) ................................
84,142 22,633 (13,797) 350,198 71,750 374,482
Other income (expenses), net ............................
9,886 (383) 27,917 100,479 30,287 91,835
Income before income taxes ............................
94,028 22,250 14,120 450,677 102,037 466,317
Income taxes and other ................................
33,536 11,908 (57,991) 93,373 (24,291) 96,882
Net income .........................................
60,492 10,342 72,111 357,304 126,328 369,435
●¥ Information of Operations Separating Out the Financial
Services Segment (Unaudited)
The following charts show Sony’s unaudited information of
operations for the Financial Services segment alone and for all
segments excluding the Financial Services segment. These
separate condensed presentations are not required under U.S.
GAAP, which is used in Sony’s consolidated financial state-
ments. However, because the Financial Services segment is
different in nature from Sony’s other segments, Sony utilizes this
information to analyze its results without Financial Services and
believes that these presentations may be useful in understand-
ing and analyzing Sony’s consolidated financial statements.
Transactions between the Financial Services segment and all
other segments excluding Financial Services are eliminated in
the consolidated figures shown below.
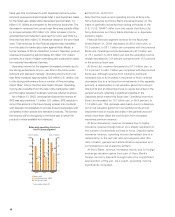
■ ALL OTHER
During the fiscal year ended March 31, 2008, sales within
All Other were comprised mainly of sales from Sony Music
Entertainment (Japan) Inc. (“SMEJ”), a Japanese domestic
recorded music business; Sony Music Entertainment Inc.’s
music publishing business; So-net Entertainment Corporation
(“So-net”), an Internet-related service business subsidiary
operating mainly in Japan; and an advertising agency
business in Japan. Trademark royalty income from Sony
Ericsson is also included in sales and operating income of
All Other.
Sales for the fiscal year ended March 31, 2008 increased
by 27.1 billion yen, or 7.6 percent, to 382.2 billion yen,
compared with the previous fiscal year. Of total sales, 82
percent were sales to outside customers. In terms of profit
performance, operating income for All Other increased by
21.3 billion yen, or 73.9 percent from the previous fiscal year,
to 50.2 billion yen.