Sony 2008 Annual Report Download - page 92
Download and view the complete annual report
Please find page 92 of the 2008 Sony annual report below. You can navigate through the pages in the report by either clicking on the pages listed below, or by using the keyword search tool below to find specific information within the annual report.-
 1
1 -
2
-
3
-
4
-
5
-
6
-
7
-
8
-
9
-
10
-
11
-
12
-
13
-
14
-
15
-
16
-
17
-
18
-
19
-
20
-
21
-
22
-
23
-
24
-
25
-
26
-
27
-
28
-
29
-
30
-
31
-
32
-
33
-
34
-
35
-
36
-
37
-
38
-
39
-
40
-
41
-
42
-
43
-
44
-
45
-
46
-
47
-
48
-
49
-
50
-
51
-
52
-
53
-
54
-
55
-
56
-
57
-
58
-
59
-
60
-
61
-
62
-
63
-
64
-
65
-
66
-
67
-
68
-
69
-
70
-
71
-
72
-
73
-
74
-
75
-
76
-
77
-
78
-
79
-
80
-
81
-
 82
82 -
 83
83 -
 84
84 -
 85
85 -
 86
86 -
 87
87 -
 88
88 -
 89
89 -
 90
90 -
 91
91 -
 92
92 -
 93
93 -
 94
94 -
 95
95 -
 96
96 -
 97
97 -
 98
98 -
 99
99 -
 100
100 -
 101
101 -
 102
102 -
103
-
104
-
105
-
106
 |
 |

90
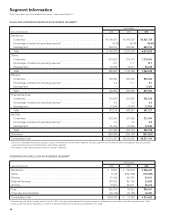
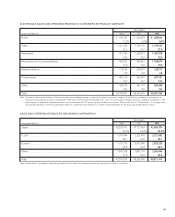
SALES AND OPERATING REVENUE BY BUSINESS SEGMENT*
Yen in millions
Years ended March 31 2006 2007 2008
Electronics
Customers ......................................................
¥4,796,061 ¥5,443,336 ¥5,931,708
Percentage of sales and operating revenue** . . . . . . . . . . . . . . . . . . . . . . . . . . . .
63.9% 65.6% 66.9%
Intersegment .....................................................
394,167 629,042 682,102
Total ...........................................................
5,190,228 6,072,378 6,613,810
Game
Customers ......................................................
918,252 974,218 1,219,004
Percentage of sales and operating revenue** . . . . . . . . . . . . . . . . . . . . . . . . . . . .
12.2 11.7 13.7
Intersegment .....................................................
40,368 42,571 65,239
Total ...........................................................
958,620 1,016,789 1,284,243
Pictures
Customers ......................................................
745,859 966,260 855,482
Percentage of sales and operating revenue** . . . . . . . . . . . . . . . . . . . . . . . . . . . .
9.9 11.7 9.7
Intersegment .....................................................
— — 2,452
Total ...........................................................
745,859 966,260 857,934
Financial Services
Customers ......................................................
720,566 624,282 553,216
Percentage of sales and operating revenue** . . . . . . . . . . . . . . . . . . . . . . . . . . . .
9.6 7.5 6.2
Intersegment .....................................................
22,649 25,059 27,905
Total ...........................................................
743,215 649,341 581,121
All Other
Customers ......................................................
329,859 287,599 312,004
Percentage of sales and operating revenue** . . . . . . . . . . . . . . . . . . . . . . . . . . . .
4.4 3.5 3.5
Intersegment .....................................................
81,676 67,525 70,194
Total ...........................................................
411,535 355,124 382,198
Elimination ........................................................
(538,860) (764,197) (847,892)
Consolidated total ..................................................
¥7,510,597 ¥8,295,695 ¥8,871,414
* Electronics intersegment amounts primarily consist of transactions with the Game segment, Pictures segment and All Other. All Other intersegment amounts primarily
consist of transactions with the Electronics and Game segments.
** Percentage of sales and operating revenue to outside customers.
Segment Information
Sony Corporation and Consolidated Subsidiaries—Years ended March 31
OPERATING INCOME (LOSS) BY BUSINESS SEGMENT*
Yen in millions
Years ended March 31 2006 2007 2008
Electronics ........................................................
¥ 8,820
¥ 160,536 ¥ 356,030
Game ............................................................
8,748
(232,325)
(124,485)
Pictures ..........................................................
27,436
42,708
54,011
Financial Services ...................................................
188,323
84,142
22,633
All Other ..........................................................
18,837
28,871
50,212
Total .............................................................
252,164
83,932 358,401
Corporate and elimination ............................................
(25,748)
(12,182) 16,081
Consolidated total ..................................................
¥226,416 ¥ 71,750 ¥ 374,482
* Commencing with the first quarter ended June 30, 2007, Sony has partly realigned its business segment configuration. In accordance with this change, results of the
previous year have been reclassified to conform to the presentation for the fiscal year ended March 31, 2008.