Sony 2008 Annual Report Download - page 91
Download and view the complete annual report
Please find page 91 of the 2008 Sony annual report below. You can navigate through the pages in the report by either clicking on the pages listed below, or by using the keyword search tool below to find specific information within the annual report.-
 1
1 -
2
-
3
-
4
-
5
-
6
-
7
-
8
-
9
-
10
-
11
-
12
-
13
-
14
-
15
-
16
-
17
-
18
-
19
-
20
-
21
-
22
-
23
-
24
-
25
-
26
-
27
-
28
-
29
-
30
-
31
-
32
-
33
-
34
-
35
-
36
-
37
-
38
-
39
-
40
-
41
-
42
-
43
-
44
-
45
-
46
-
47
-
48
-
49
-
50
-
51
-
52
-
53
-
54
-
55
-
56
-
57
-
58
-
59
-
60
-
61
-
62
-
63
-
64
-
65
-
66
-
67
-
68
-
69
-
70
-
71
-
72
-
73
-
74
-
75
-
76
-
77
-
78
-
79
-
80
-
 81
81 -
 82
82 -
 83
83 -
 84
84 -
 85
85 -
 86
86 -
 87
87 -
 88
88 -
 89
89 -
 90
90 -
 91
91 -
 92
92 -
 93
93 -
 94
94 -
 95
95 -
 96
96 -
 97
97 -
 98
98 -
 99
99 -
 100
100 -
 101
101 -
102
-
103
-
104
-
105
-
106
 |
 |

89
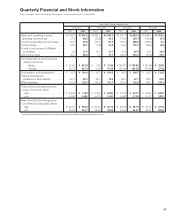
Quarterly Financial and Stock Information
Sony Corporation and Consolidated Subsidiaries—Years ended March 31 (Unaudited)
Yen in billions (Yen per share amounts)
1st quarter 2nd quarter 3rd quarter 4th quarter
2007 2008 2007 2008 2007 2008 2007 2008
Sales and operating revenue . . . . . . .
¥1,744.2 ¥1,976.5 ¥1,854.2 ¥2,083.0 ¥2,607.7 ¥2,859.0 ¥2,089.6 ¥1,952.8
Operating income (loss) . . . . . . . . . . .
27.0 99.3 (20.8) 90.5 178.9 189.4 (113.4) (4.7)
Income (loss) before income taxes . . .
54.0 83.8 (26.1) 87.9 179.8 288.5 (105.7) 6.2
Income taxes ...................
24.8 39.7 (7.6) 34.9 61.5 135.2 (24.9) (6.3)
Equity in net income of affiliated
companies ....................
3.6 22.0 19.7 21.1 43.0 46.9 12.3 10.8
Net income (loss) . . . . . . . . . . . . . . . .
32.3 66.5 1.7 73.7 159.9 200.2 (67.6) 29.0
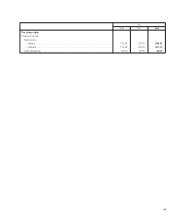
Per share data of common stock
Net income (loss)
—Basic ....................
¥ 32.25 ¥ 66.29 ¥ 1.68 ¥ 73.50 ¥ 159.70 ¥ 199.60 ¥ (67.44) ¥ 28.95
—Diluted ...................
30.75 63.14 1.60 70.09 152.49 190.29 (67.44) 27.63
Depreciation and amortization* ......
¥ 91.3 ¥ 104.0 ¥ 93.7 ¥ 100.6 ¥ 99.9 ¥ 109.7 ¥ 115.2 ¥ 113.8
Capital expenditures
(additions to fixed assets) .........
134.1 95.0 90.0 75.8 88.0
67.1 102.1 97.9
R&D expenses ..................
119.4 126.0 143.5 131.7 133.5 125.5 147.6 137.4
Tokyo Stock Exchange price per
share of common stock:
High ........................
¥ 6,200 ¥ 7,190 ¥ 5,360 ¥ 6,580 ¥ 5,190 ¥ 6,410 ¥ 6,540 ¥ 6,300
Low ........................
4,660 5,860 4,610 5,050 4,340 5,100 5,120 3,910
New York Stock Exchange price
per American Depositary Share:
High ........................
$ 52.29 $ 59.84 $ 46.40 $ 54.12 . $ 43.78
$ 56.75 $ 53.34 $ 57.19
Low ........................
40.67 49.77 39.30 43.86 37.24 44.57 42.73 39.91
* Including amortization expenses for intangible assets and for deferred insurance acquisition costs