Sony 2008 Annual Report Download - page 3
Download and view the complete annual report
Please find page 3 of the 2008 Sony annual report below. You can navigate through the pages in the report by either clicking on the pages listed below, or by using the keyword search tool below to find specific information within the annual report.-
 1
1 -
 2
2 -
 3
3 -
 4
4 -
 5
5 -
 6
6 -
 7
7 -
 8
8 -
 9
9 -
 10
10 -
 11
11 -
 12
12 -
 13
13 -
 14
14 -
15
-
16
-
17
-
18
-
19
-
20
-
21
-
22
-
23
-
24
-
25
-
26
-
27
-
28
-
29
-
30
-
31
-
32
-
33
-
34
-
35
-
36
-
37
-
38
-
39
-
40
-
41
-
42
-
43
-
44
-
45
-
46
-
47
-
48
-
49
-
50
-
51
-
52
-
53
-
54
-
55
-
56
-
57
-
58
-
59
-
60
-
61
-
62
-
63
-
64
-
65
-
66
-
67
-
68
-
69
-
70
-
71
-
72
-
73
-
74
-
75
-
76
-
77
-
78
-
79
-
80
-
81
-
82
-
83
-
84
-
85
-
86
-
87
-
88
-
89
-
90
-
91
-
92
-
93
-
94
-
95
-
96
-
97
-
98
-
99
-
100
-
101
-
102
-
103
-
104
-
105
-
106
 |
 |

1
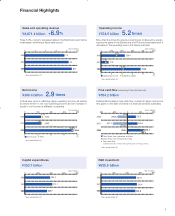
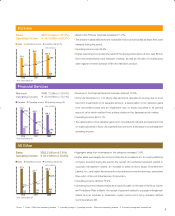
Financial Highlights
Sales and operating revenue Operating income
¥8,871.4 billion +6.9%¥374.5 billion 5.2 times
Rose 6.9%, owing to increased sales in the Electronics and Game
businesses, achieving a fi scal-year record
More than fi ve times the previous year’s level, bolstered by operat-
ing income gains in the Electronics and Pictures businesses and a
decrease in the operating loss in the Game business
Net income Free cash fl ow (excluding Financial Services)
¥369.4 billion 2.9 times ¥504.2 billion
A fi scal year record, refl ecting higher operating income, as well as
an improvement in net non-operating income and an increase in
equity in net income of affi liated companies
Substantial increase in free cash fl ow, a result of higher net income
and gains on the sale of shares in a fi nancial services subsidiary
R&D investment
¥335.7 billion ¥520.6 billion
Capital expenditures
(Yen in trillions)
40
7.5
8.3
8.9
68102
2006
2007
2008
(Yen in billions)
(%)
2000
226.4
71.8
374.5
300 400 500100
3.0%
0.9%
4.2%
4068102
2006
2007
2008
*Years ended March 31 Operating income Operating margin
*Years ended March 31
(Yen in billions)
(%)
123.6
126.3
369.4
2000 300 400100
4.1%
3.8%
10.8%
609123
2006
2007
2008
(Yen in billions)
0-800
252.0
305.6
519.1
400 800-400
(296.4)
(431.1)
(14.9)
(44.4)
(125.5)
504.2
2006
2007
2008
Net income ROE
*Years ended March 31
Cash fl ows from operating activities
Cash fl ows from investing activities
Free cash fl ow
(Combined total of cash fl ows from operating and investing activities)
*Years ended March 31
(Yen in billions)
4000
384.3
414.1
335.7
600 800200
2006
2007
2008
(Yen in billions)
4000
531.8
543.9
520.6
600 800200
2006
2007
2008
*Years ended March 31 *Years ended March 31
08SonyE_P1_P13_0804.indd 108SonyE_P1_P13_0804.indd 1 08.8.7 2:17:37 PM08.8.7 2:17:37 PM