Sony 2008 Annual Report Download - page 54
Download and view the complete annual report
Please find page 54 of the 2008 Sony annual report below. You can navigate through the pages in the report by either clicking on the pages listed below, or by using the keyword search tool below to find specific information within the annual report.-
 1
1 -
2
-
3
-
4
-
5
-
6
-
7
-
8
-
9
-
10
-
11
-
12
-
13
-
14
-
15
-
16
-
17
-
18
-
19
-
20
-
21
-
22
-
23
-
24
-
25
-
26
-
27
-
28
-
29
-
30
-
31
-
32
-
33
-
34
-
35
-
36
-
37
-
38
-
39
-
40
-
41
-
42
-
43
-
 44
44 -
 45
45 -
 46
46 -
 47
47 -
 48
48 -
 49
49 -
 50
50 -
 51
51 -
 52
52 -
 53
53 -
 54
54 -
 55
55 -
 56
56 -
 57
57 -
 58
58 -
 59
59 -
 60
60 -
 61
61 -
 62
62 -
 63
63 -
 64
64 -
65
-
66
-
67
-
68
-
69
-
70
-
71
-
72
-
73
-
74
-
75
-
76
-
77
-
78
-
79
-
80
-
81
-
82
-
83
-
84
-
85
-
86
-
87
-
88
-
89
-
90
-
91
-
92
-
93
-
94
-
95
-
96
-
97
-
98
-
99
-
100
-
101
-
102
-
103
-
104
-
105
-
106
 |
 |

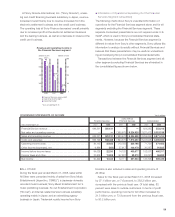
52
OPERATING PERFORMANCE
Yen in billions Percent change
Years ended March 31 2007 2008 2008/2007
Sales and operating revenue . .
8,295.7 8,871.4 +6.9%
Operating income ...........
71.8 374.5 +421.9
Income before income taxes . .
102.0 466.3 +357.0
Equity in net income of
affiliated companies ........
78.7 100.8 +28.2
Net income ...............
126.3 369.4 +192.4
SALES
Sales for the fiscal year ended March 31, 2008 increased by
575.7 billion yen, or 6.9 percent, to 8,871.4 billion yen com-
pared with the previous fiscal year. A further breakdown of sales
figures is presented under “Operating Performance by Business
Segment” below.
“Sales” in this analysis of the ratio of cost of sales, including
research and development costs, and selling, general and
administrative expenses to sales refers only to the “net sales”
and “other operating revenue” portions of consolidated sales
and operating revenue, and excludes financial service revenue.
This is because financial service expenses are recorded sepa-
rately from cost of sales and selling, general and administrative
expenses. The calculations of all ratios below that pertain to
business segments include intersegment transactions.
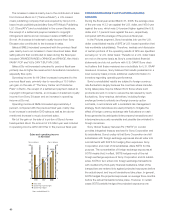
COST OF SALES AND SELLING, GENERAL AND
ADMINISTRATIVE EXPENSE
Cost of sales for the fiscal year ended March 31, 2008 increased
by 400.4 billion yen, or 6.8 percent, to 6,290.0 billion yen com-
pared with the previous fiscal year, and decreased from 76.8
percent to 75.6 percent as a percentage of sales. Year on year,
the cost of sales ratio decreased from 78.8 percent to 77.9
percent in the Electronics segment, decreased from 102.8 per-
cent to 93.9 percent in the Game segment, and decreased from
60.3 percent to 58.6 percent in the Pictures segment.
In the Electronics segment, there was an improvement in the
cost of sales ratio for several products, in particular PCs, com-
pact digital cameras and video cameras. The cost of sales ratio
in the Game segment improved primarily as a result of PS3
hardware cost reductions and increased sales of PS3 software.
In the Pictures segment, the cost of sales ratio decreased com-
pared to the previous fiscal year mainly due to the higher home
entertainment and television revenues from prior year films.
Personnel-related costs included in cost of sales were 487.8
billion yen, an increase of 30.5 billion yen, primarily recorded
within the Electronics segment.
Research and development costs (all research and develop-
ment costs are included within cost of sales) for the fiscal year
ended March 31, 2008 decreased by 23.4 billion yen to 520.6
billion yen compared with the previous fiscal year. The ratio of
research and development costs to sales was 6.3 percent
compared to 7.1 percent in the previous fiscal year.
Selling, general and administrative expenses for the fiscal year
ended March 31, 2008 decreased by 74.0 billion yen, or 4.1
percent, to 1,714.4 billion yen compared with the previous fiscal
year. The ratio of selling, general and administrative expenses to
sales decreased from 23.3 percent in the previous fiscal year to
20.6 percent. Year on year, the ratio of selling, general and
administrative expenses to sales decreased from 18.2 percent
to 16.2 percent in the Electronics segment. This improvement is
due to the recording of the provision for charges related to the
notebook computer battery pack recalls and subsequent global
replacement program in the previous fiscal year and a reversal of
the portion of the provision in the fiscal year ended March 31,
2008 based on the actual results of recalls and replacements as
compared to original estimates. The ratio of selling, general and
administrative expenses to sales decreased from 20.0 percent
to 15.8 percent in the Game segment and from 35.2 percent to
35.1 percent in the Pictures segment.
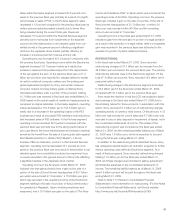
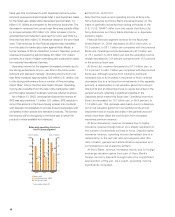
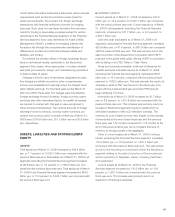
Sales and operating revenue
and operating income
■ Sales and operating revenue (left)
■ Operating income (right)
● Operating margin
*Years ended March 31
(Yen in trillions) (Yen in billions)
10.0
7.5
5.0
2.5
0
1,000
750
500
250
0
2006 2007 2008
3.0%
0.9%
4.2%